Altcoin Weekly Analysis: BD Pulse at 64 and Extreme Index +1.01σ
Weekly Market Context
The altcoin market is navigating a period of heightened optimism, reflected in our BD Pulse score of 64/100. The BD Extreme Index has pushed into overbought territory at +1.01σ, suggesting the current rally may be due for a cooling-off period. With Bitcoin dominance holding steady at 52.49%, the broader market remains tethered to BTC’s price action. Still, the positive funding rate of +0.0056% indicates traders are willing to pay a premium to maintain long exposure as they hunt for alpha in the altcoin space.
Weekly Snapshot Table
| Coin | Price | Weekly RSI | Bias |
|---|---|---|---|
| SOL | $104.27 | 58.5978 | range-bound |
| XRP | $1.3966 | 51.9209 | range-bound |
| BNB | $743.79 | 59.8927 | bullish momentum |
| DOGE | $0.0894 | 48.1357 | range-bound |
| LTC | $54.42 | 51.5342 | range-bound |
| TRX | $0.3362 | 55.0048 | bullish momentum |
Solana (SOL)
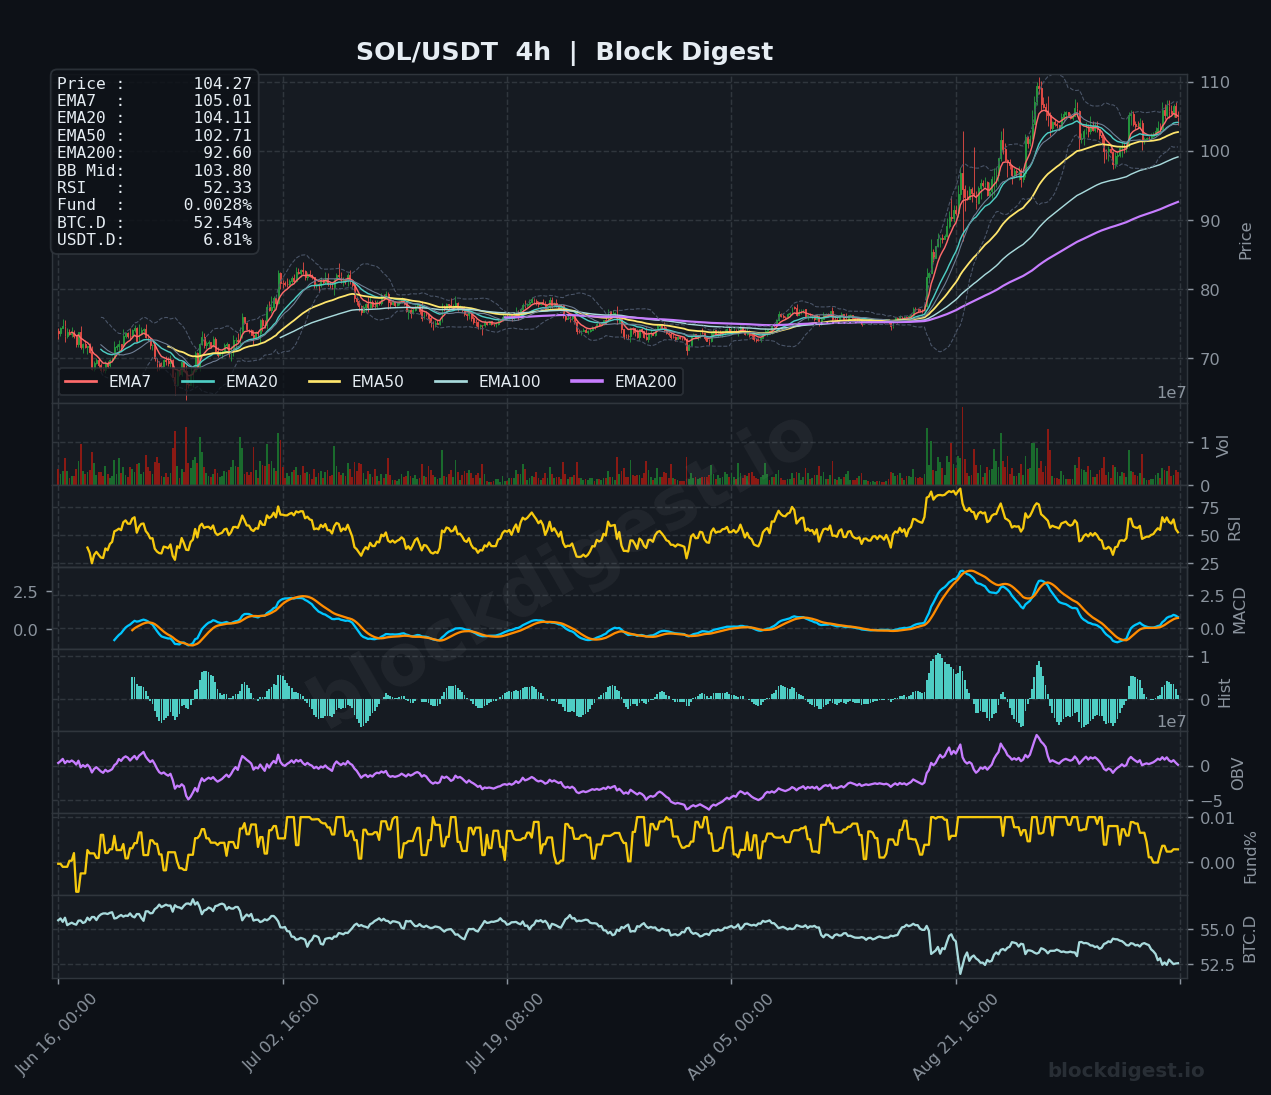
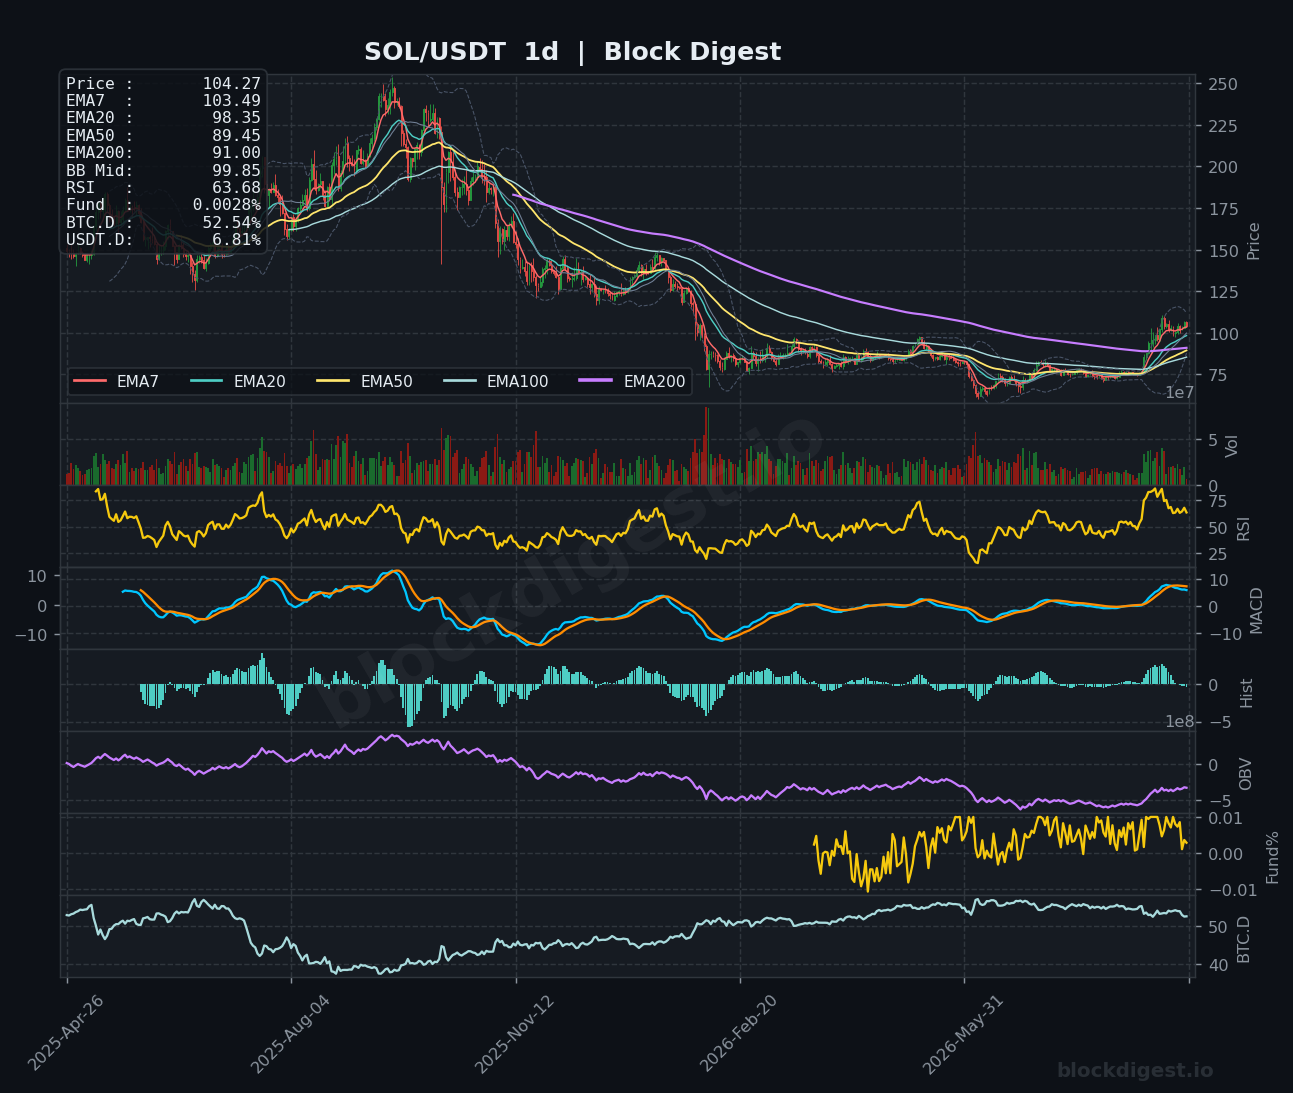
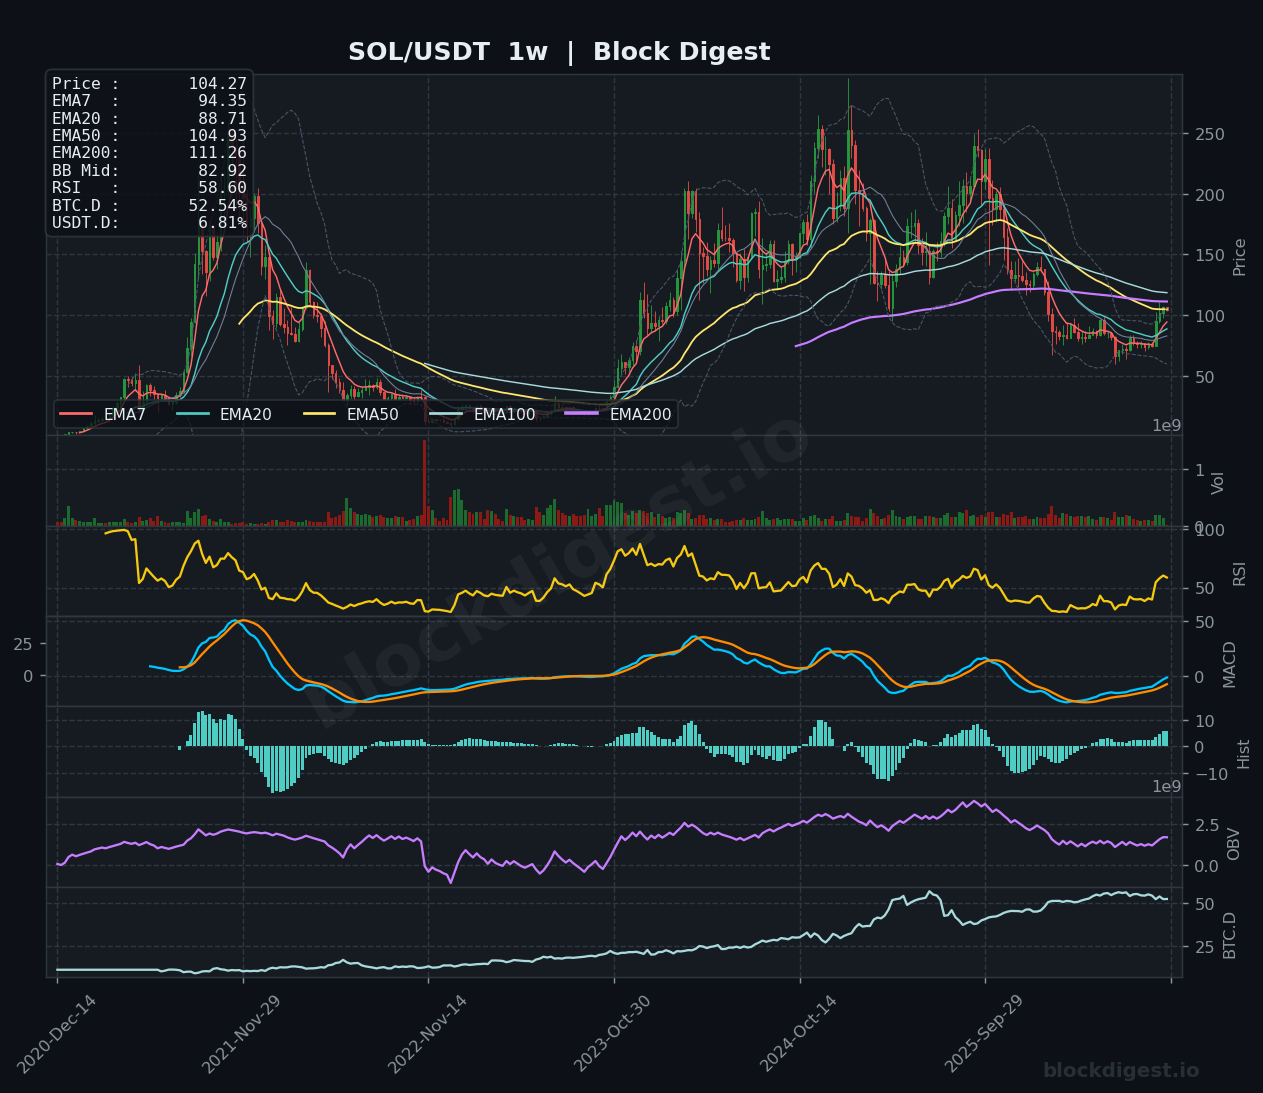
Solana maintained a constructive posture this week, holding firmly above the $100 psychological threshold as it consolidated recent gains. The daily timeframe reveals a healthy RSI of 63.68, signaling sustained bullish momentum without reaching overextended territory. While the MACD histogram on the daily chart shows a slight contraction, the 4-hour chart remains supportive with the price trading comfortably above its 20-day and 50-day EMAs. The asset is currently testing the upper reaches of its Bollinger Band range near $107; traders are watching for a decisive breakout above this resistance to confirm the next leg higher. The near-term bias remains optimistic as long as the $98 support level holds.
XRP (XRP)
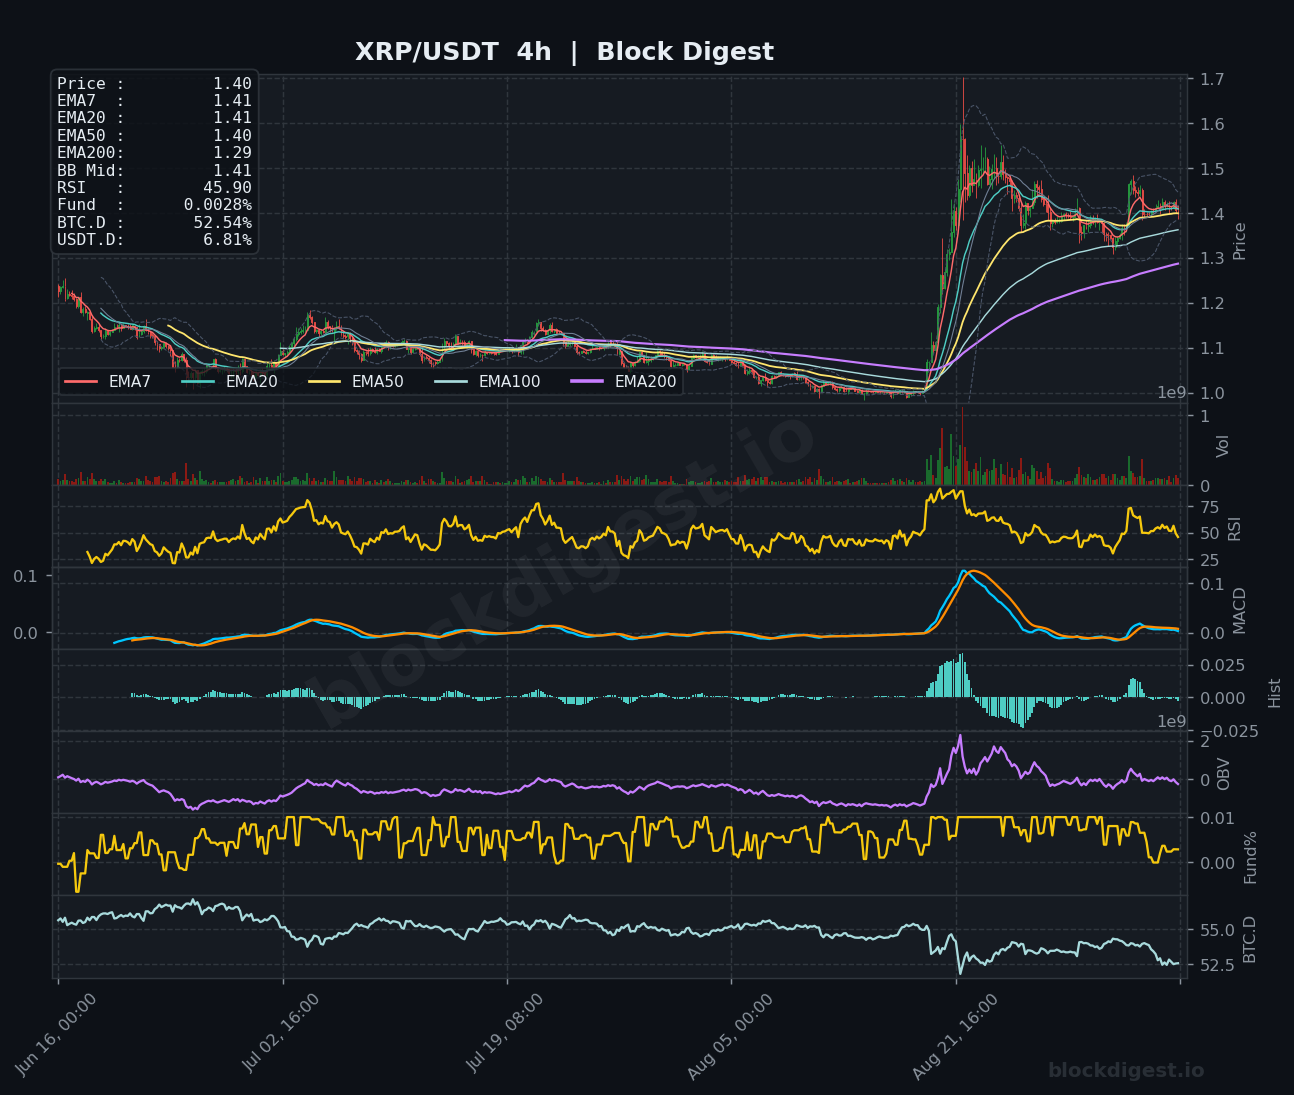
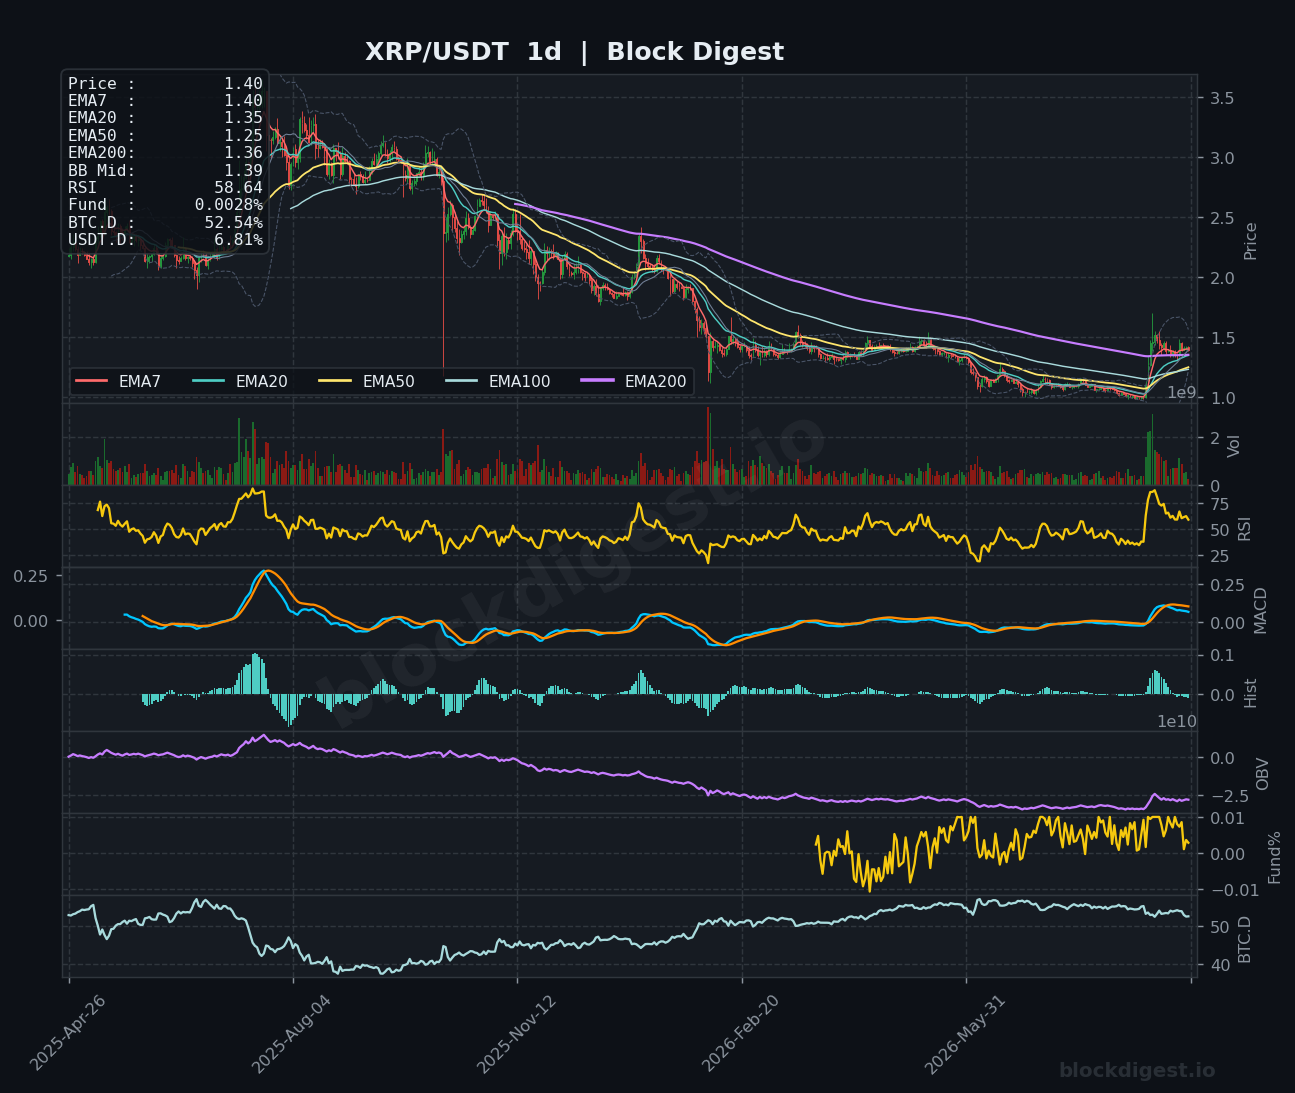
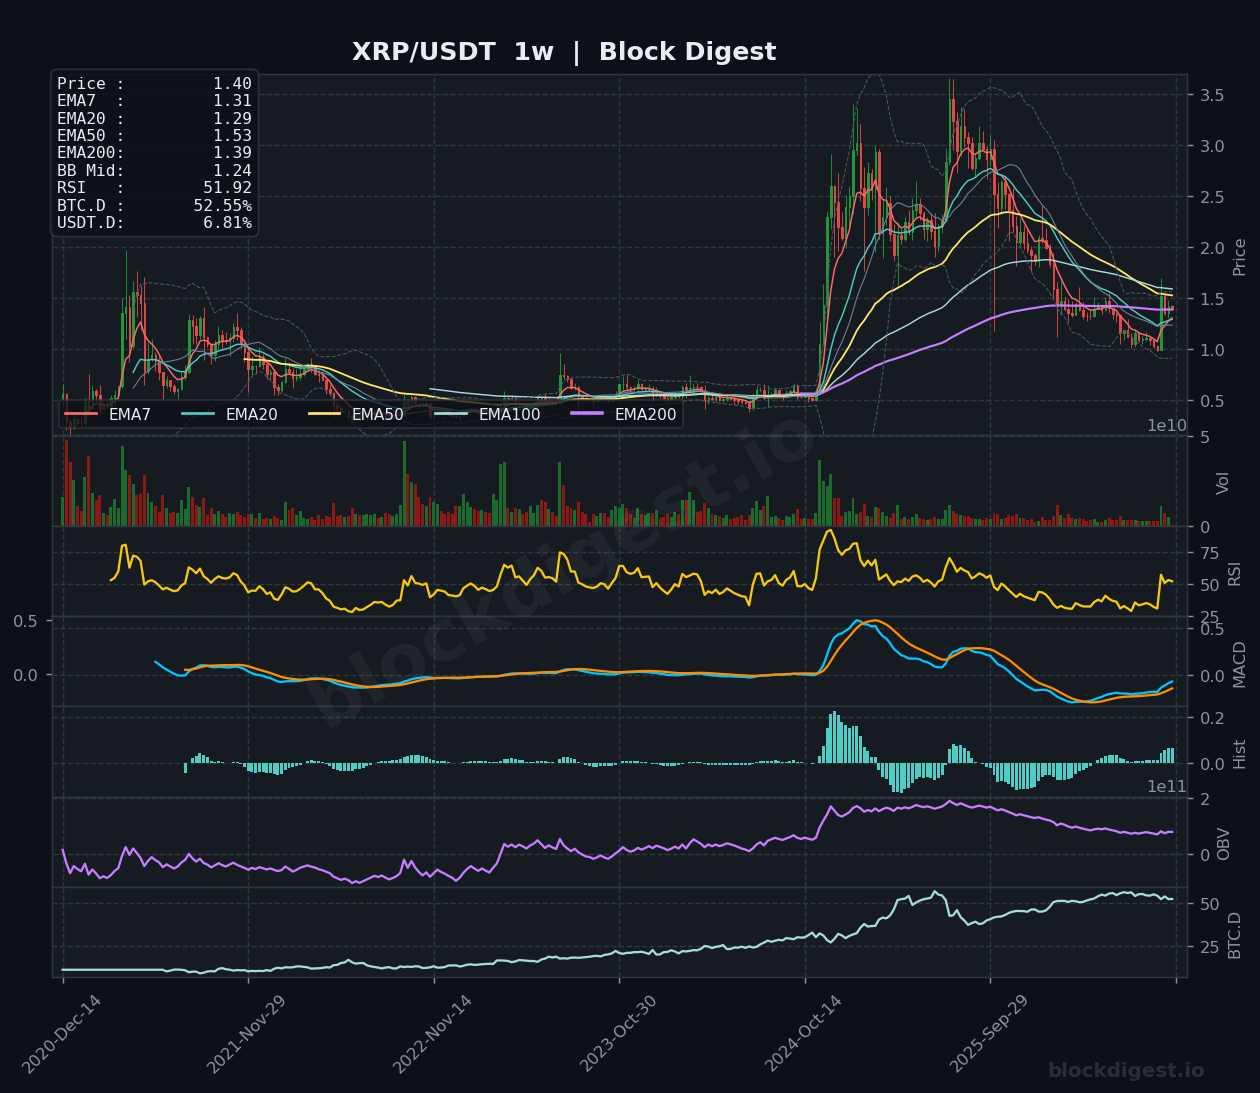
XRP traded with consolidation this week, hovering near the $1.40 mark as it attempts to solidify its position above the daily EMA200 of $1.35. The 4h timeframe reveals a tightening range between the $1.38 lower and $1.44 upper Bollinger Bands, while the RSI at 45.90 suggests a neutral stance following recent volatility. Although the daily MACD histogram remains slightly negative at -0.0091, the price is successfully holding above the weekly EMA200, signaling a potential shift in long-term structure. Watch for a decisive break above the $1.45 resistance level to confirm a bullish continuation, as failure to hold current support could invite a retest of the $1.30 zone.
BNB (BNB)
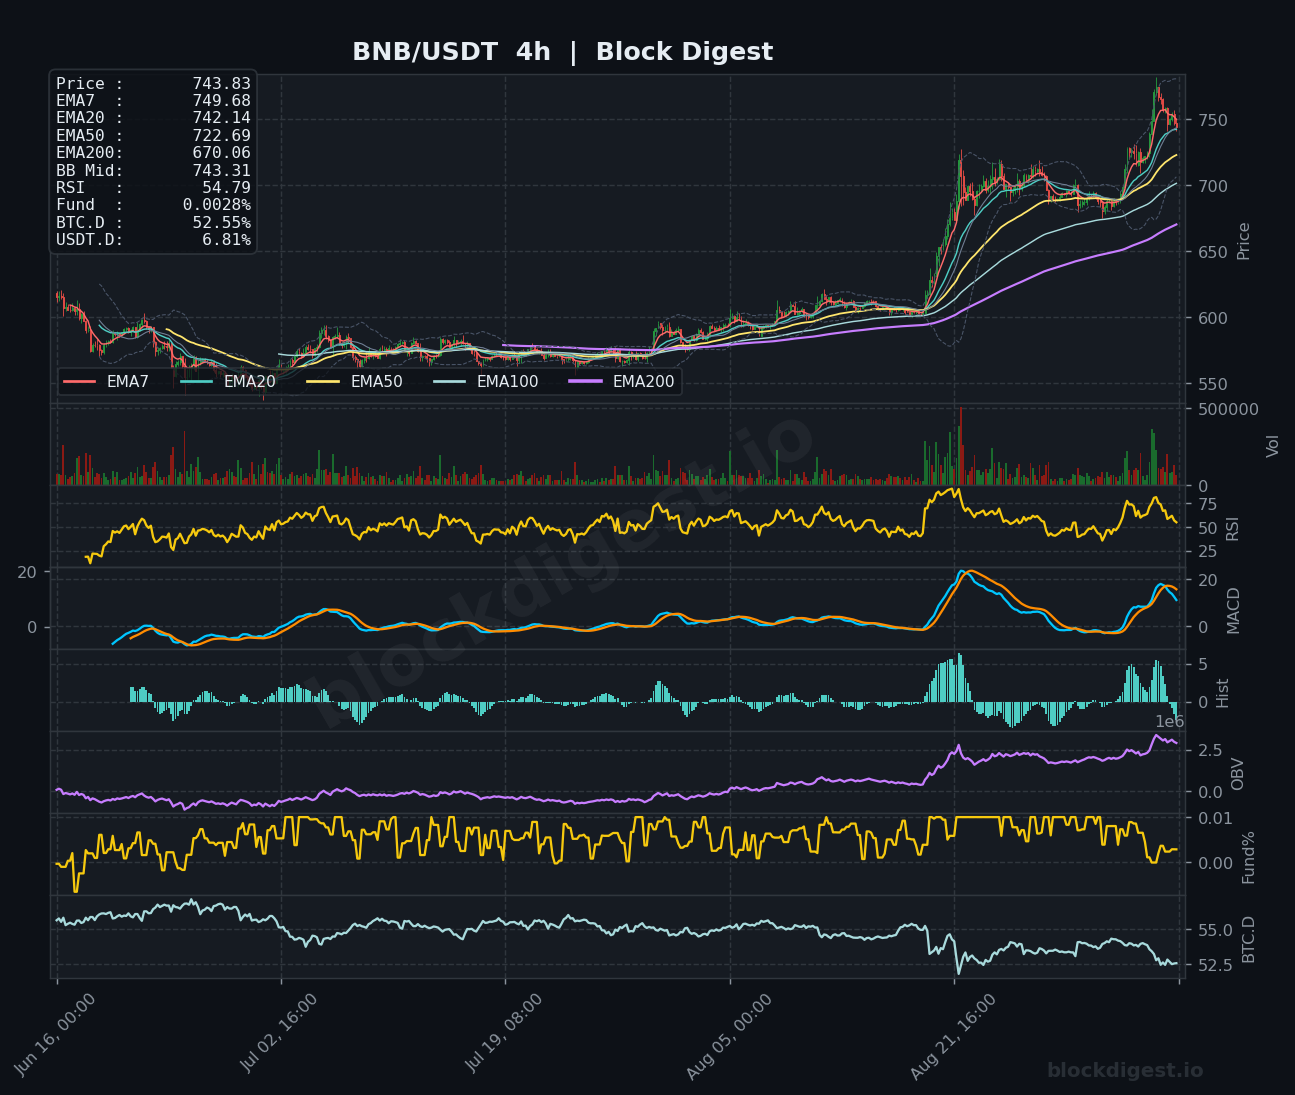
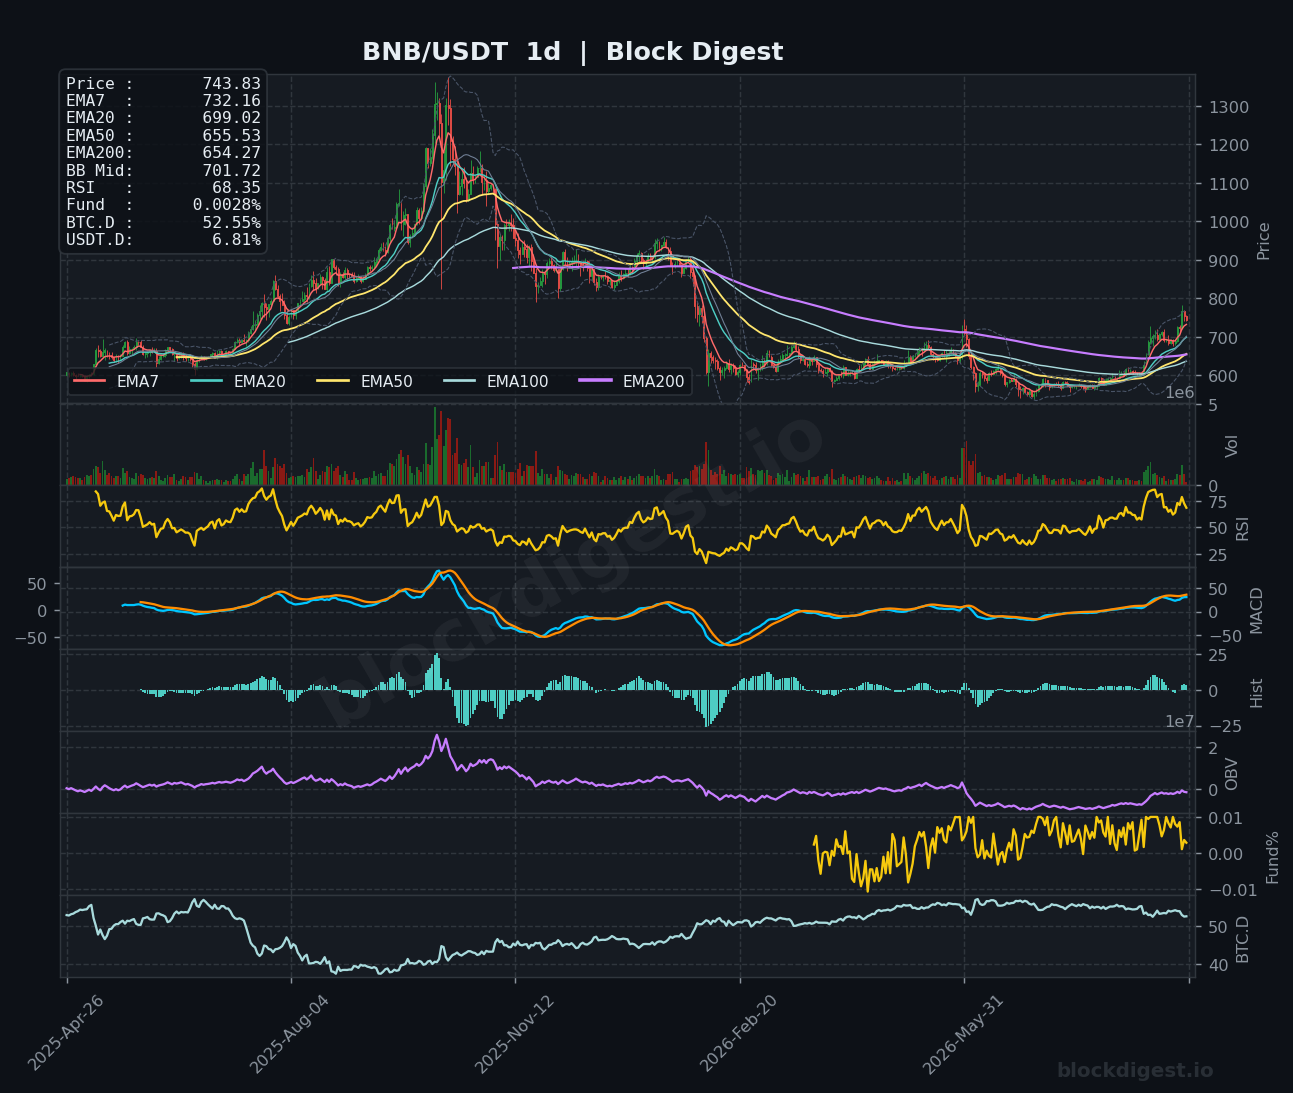
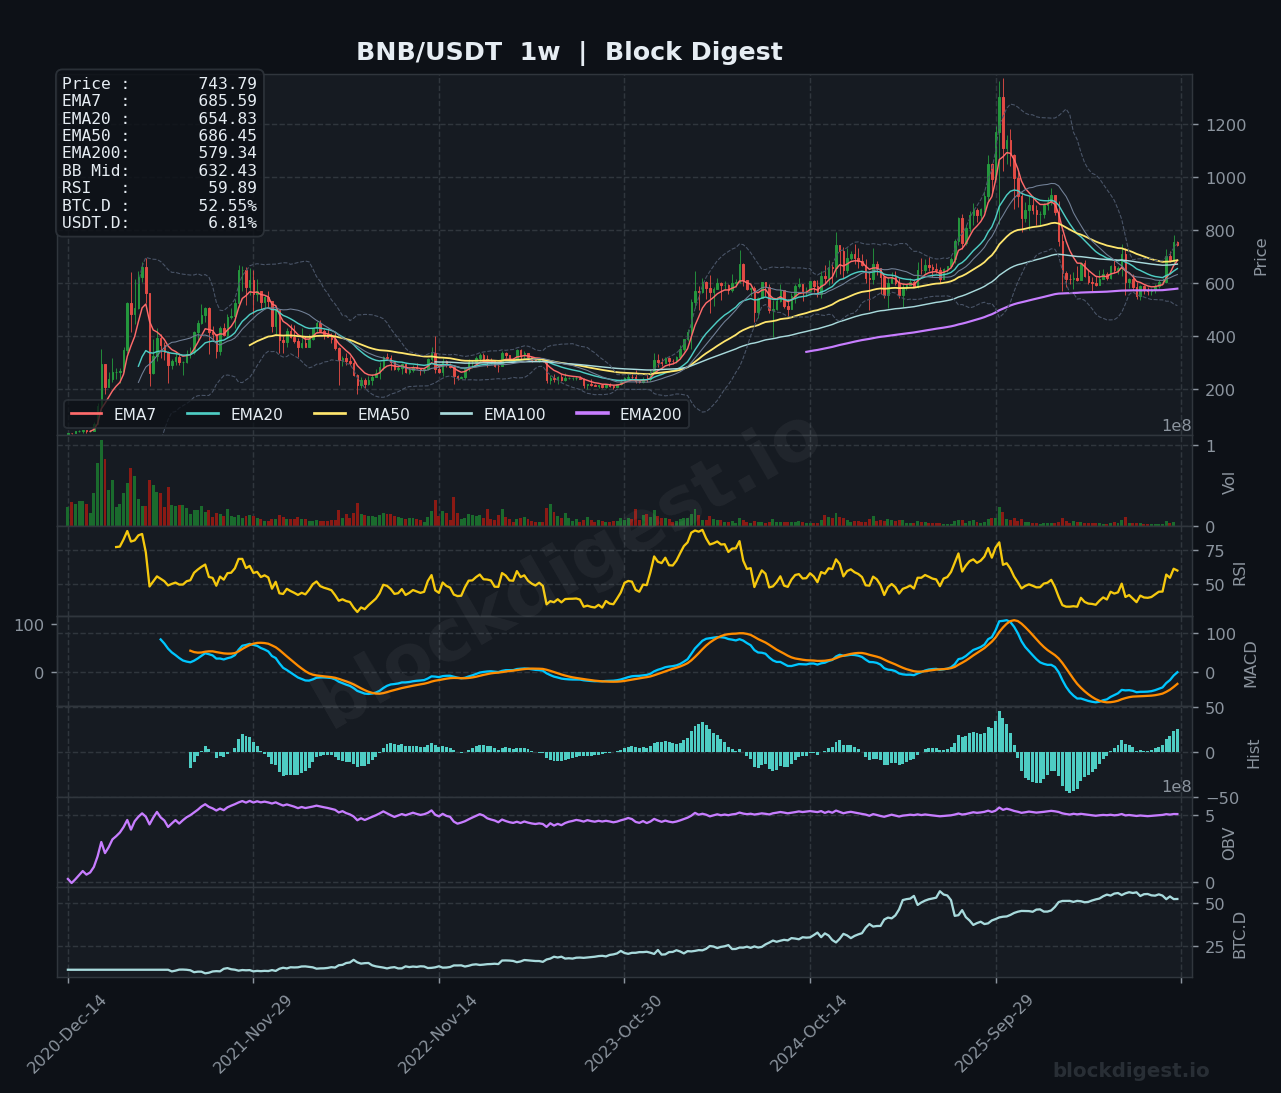
BNB demonstrated significant strength this week, reclaiming the $740 level and maintaining a bullish posture across all major timeframes. The daily chart reveals a decisive breakout above the 20-day EMA, with the RSI climbing to 68.35, signaling robust buying pressure as the asset approaches the upper Bollinger Band at $763. While the 4-hour MACD shows a slight cooling with a negative histogram reading of -2.41, the broader trend remains firmly supported by the weekly MACD crossover and a healthy OBV trajectory. Monitor the $743 support zone closely; holding this level is essential to sustain the current momentum toward the next resistance target near $780.
Dogecoin (DOGE)
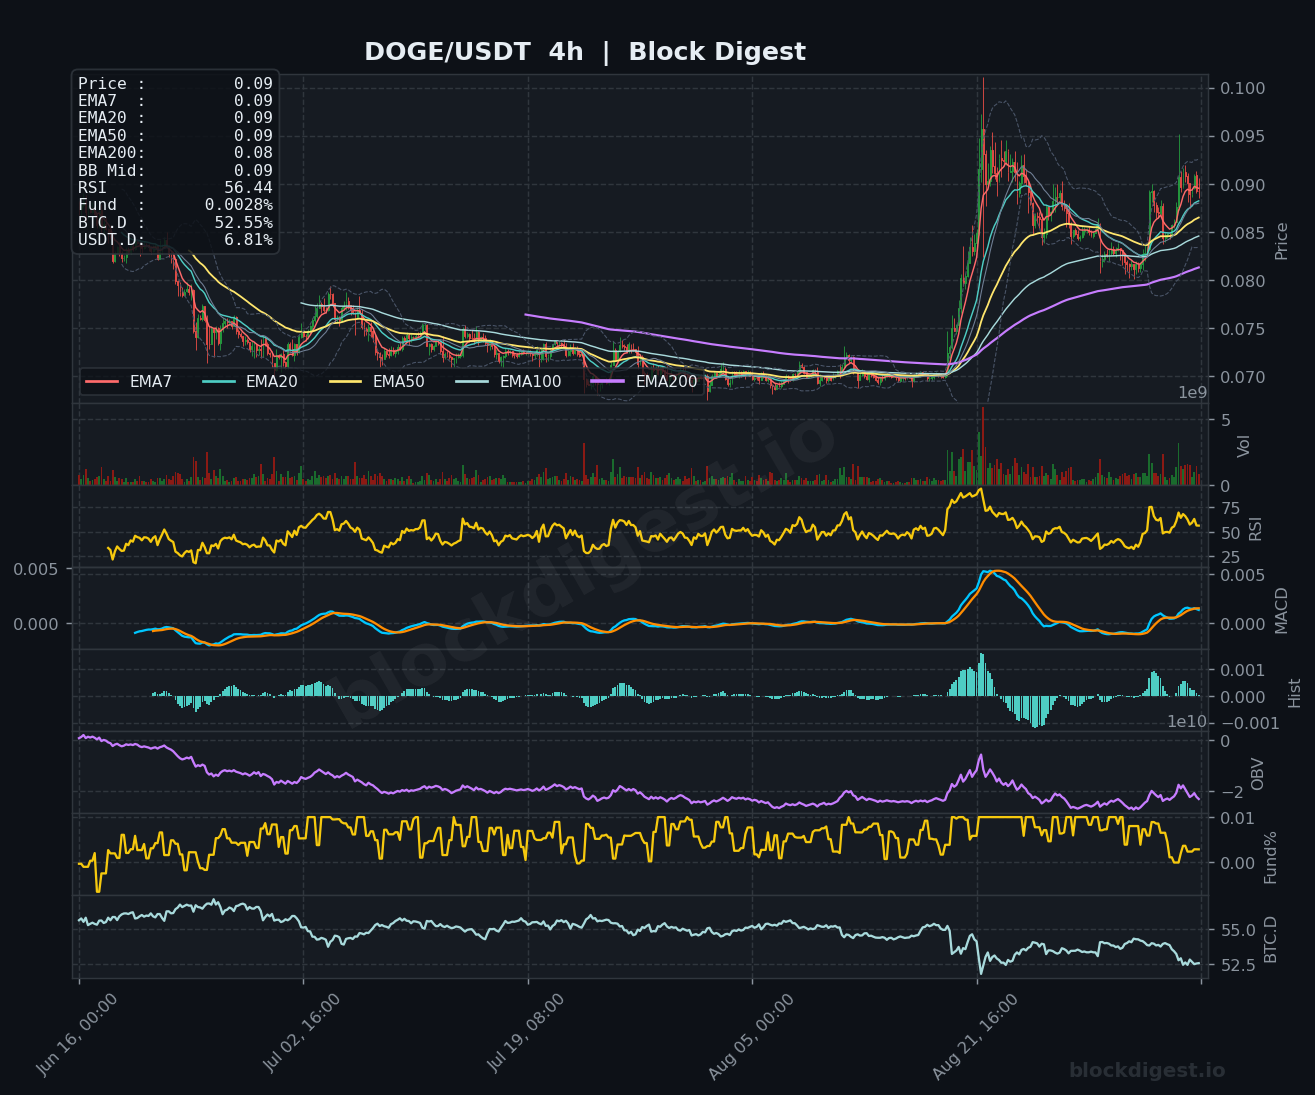
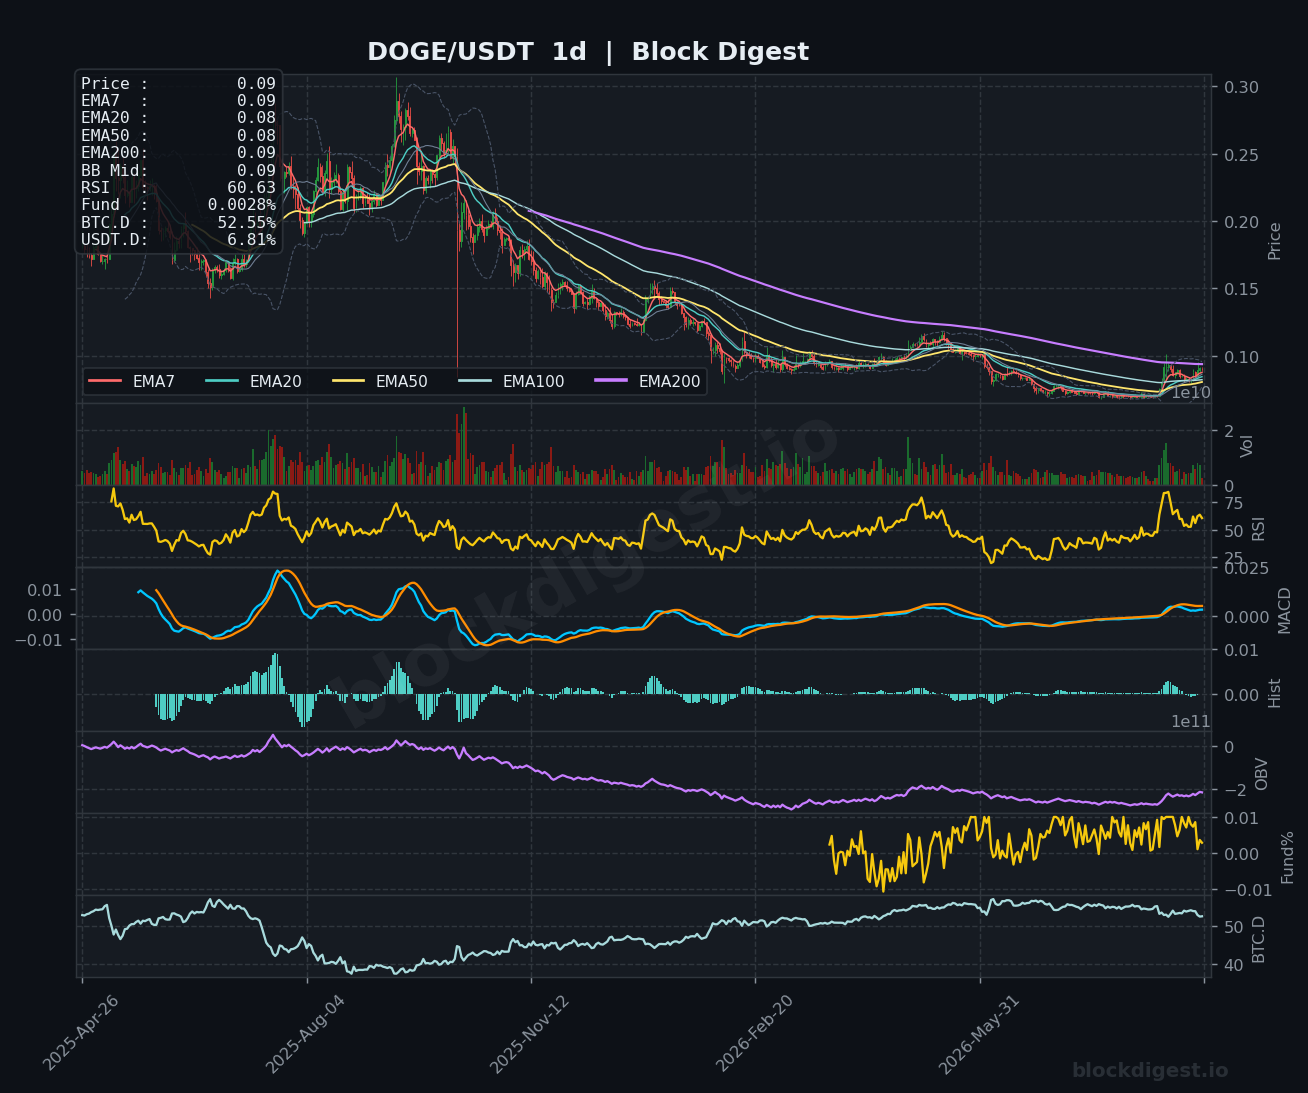
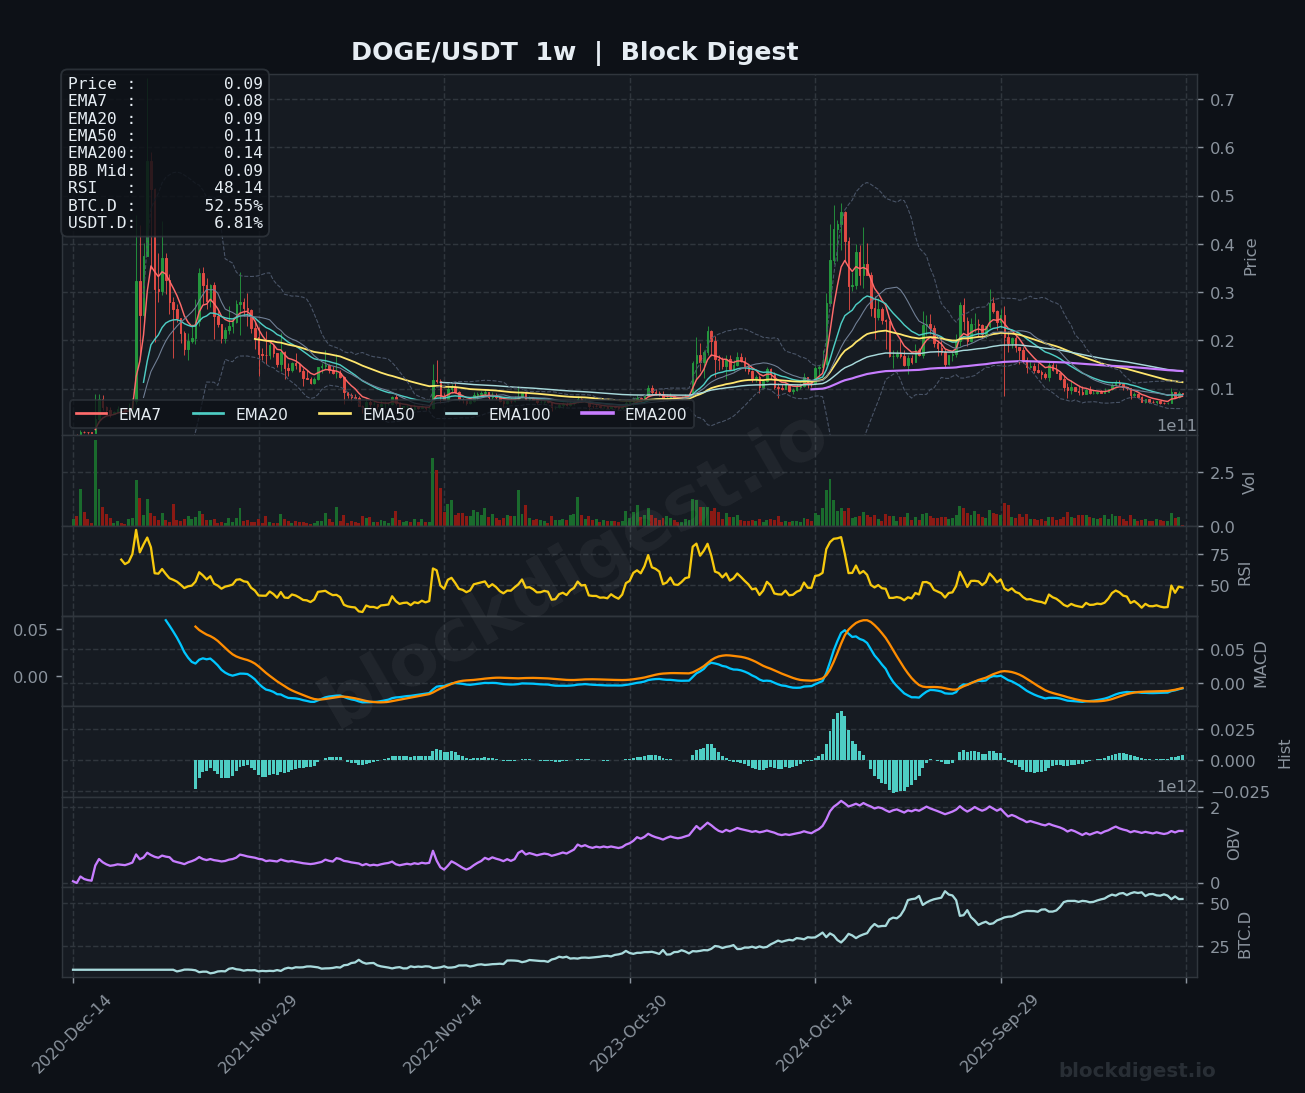
Dogecoin has staged a notable recovery this week, climbing to $0.0893 as it successfully reclaimed its 20-day and 50-day EMAs on the daily timeframe. The asset is testing the upper bounds of its recent consolidation range, supported by a constructive RSI of 60.63 that suggests building bullish momentum. With the MACD histogram turning positive and price action holding firmly above the $0.088 mid-Bollinger Band, the immediate bias leans toward a test of the $0.095 resistance level. Sustaining this momentum is critical, as the weekly chart shows the asset still faces a long-term hurdle near the $0.11 EMA50, necessitating a clean breakout above current local resistance to confirm a broader trend reversal.
Litecoin (LTC)
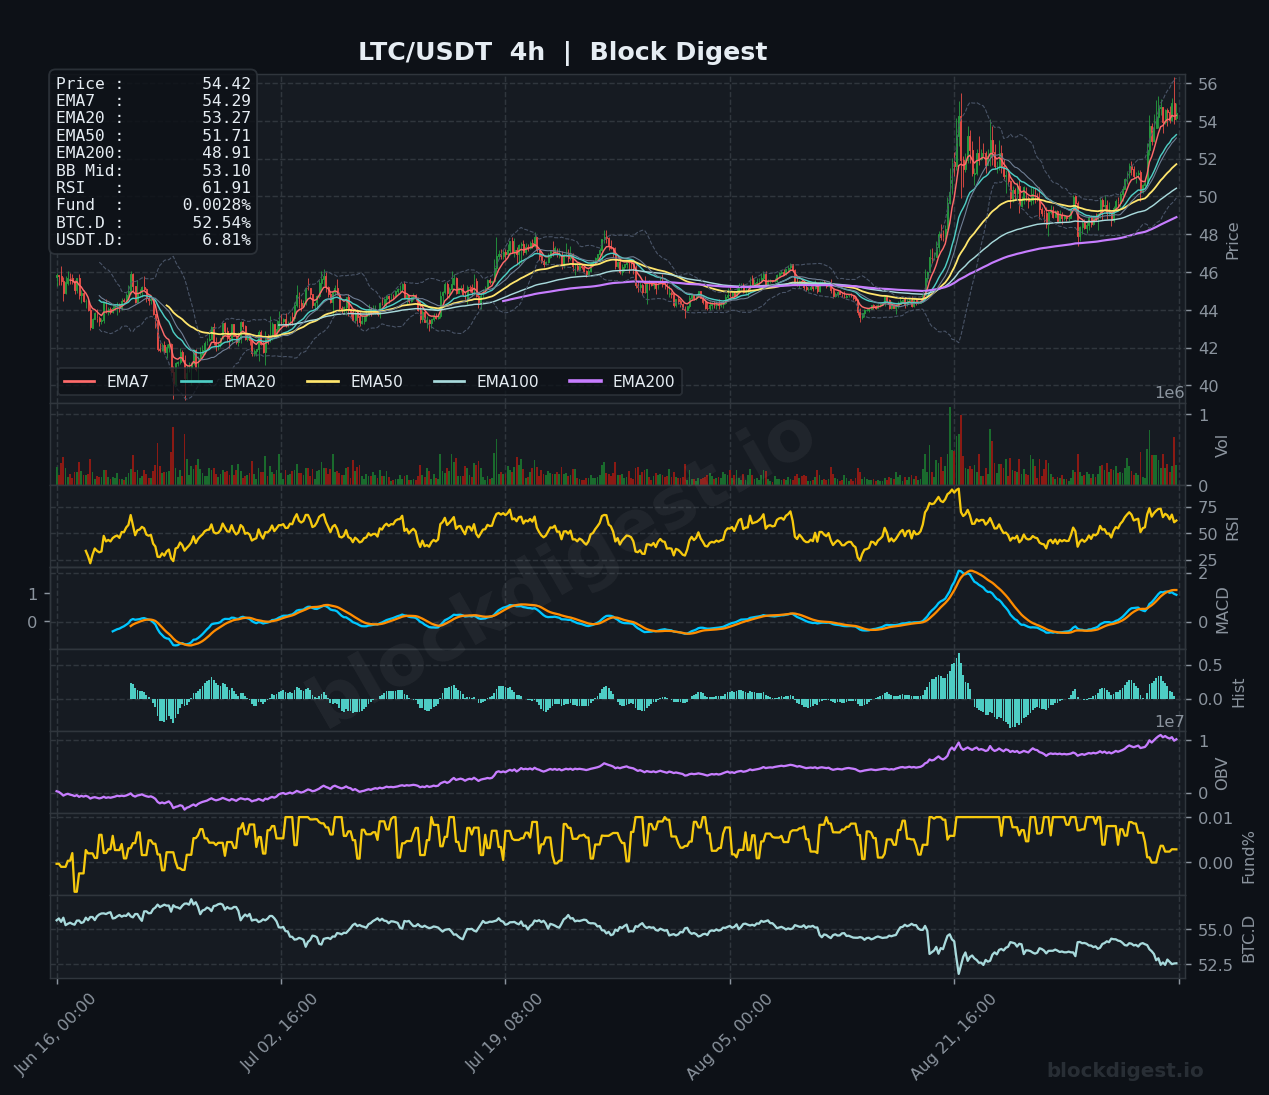
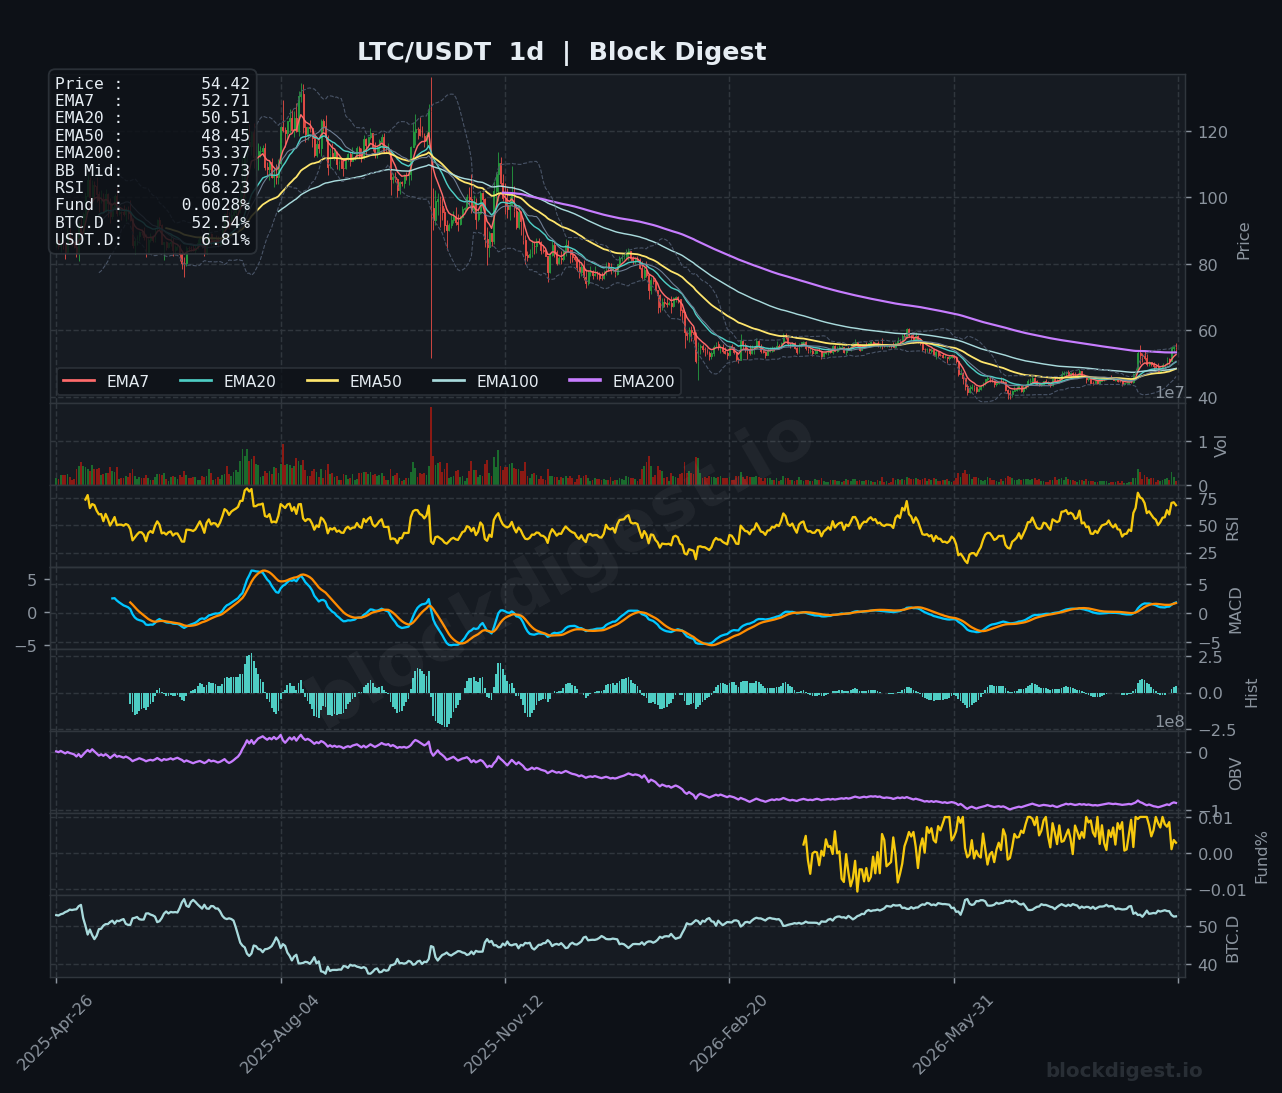
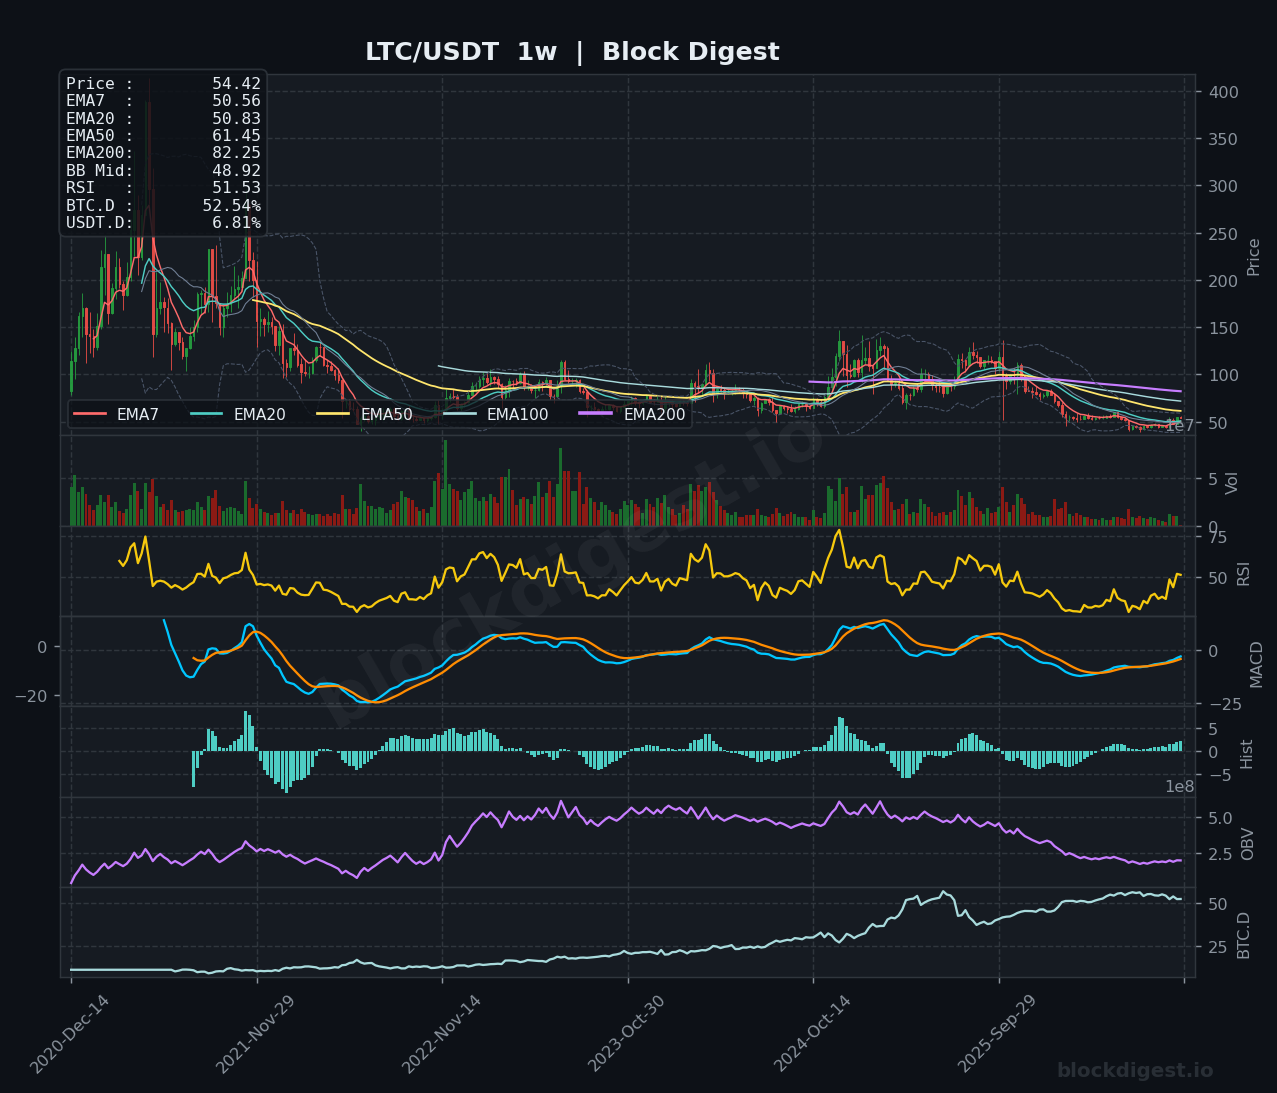
Litecoin surged this week, reclaiming the $54.42 level and decisively breaking above its daily 200-day EMA of $53.37. The daily RSI has climbed to 68.23, signaling strong bullish momentum as the MACD histogram remains positive. With the price now trading near the upper Bollinger Band on the daily timeframe, the immediate focus shifts to maintaining support above the $53.00 pivot. While the weekly RSI sits at a neutral 51.53, the recent breakout suggests a potential shift in trend, provided the asset can consolidate these gains without a rapid retreat toward the $50.00 psychological floor.
TRON (TRX)
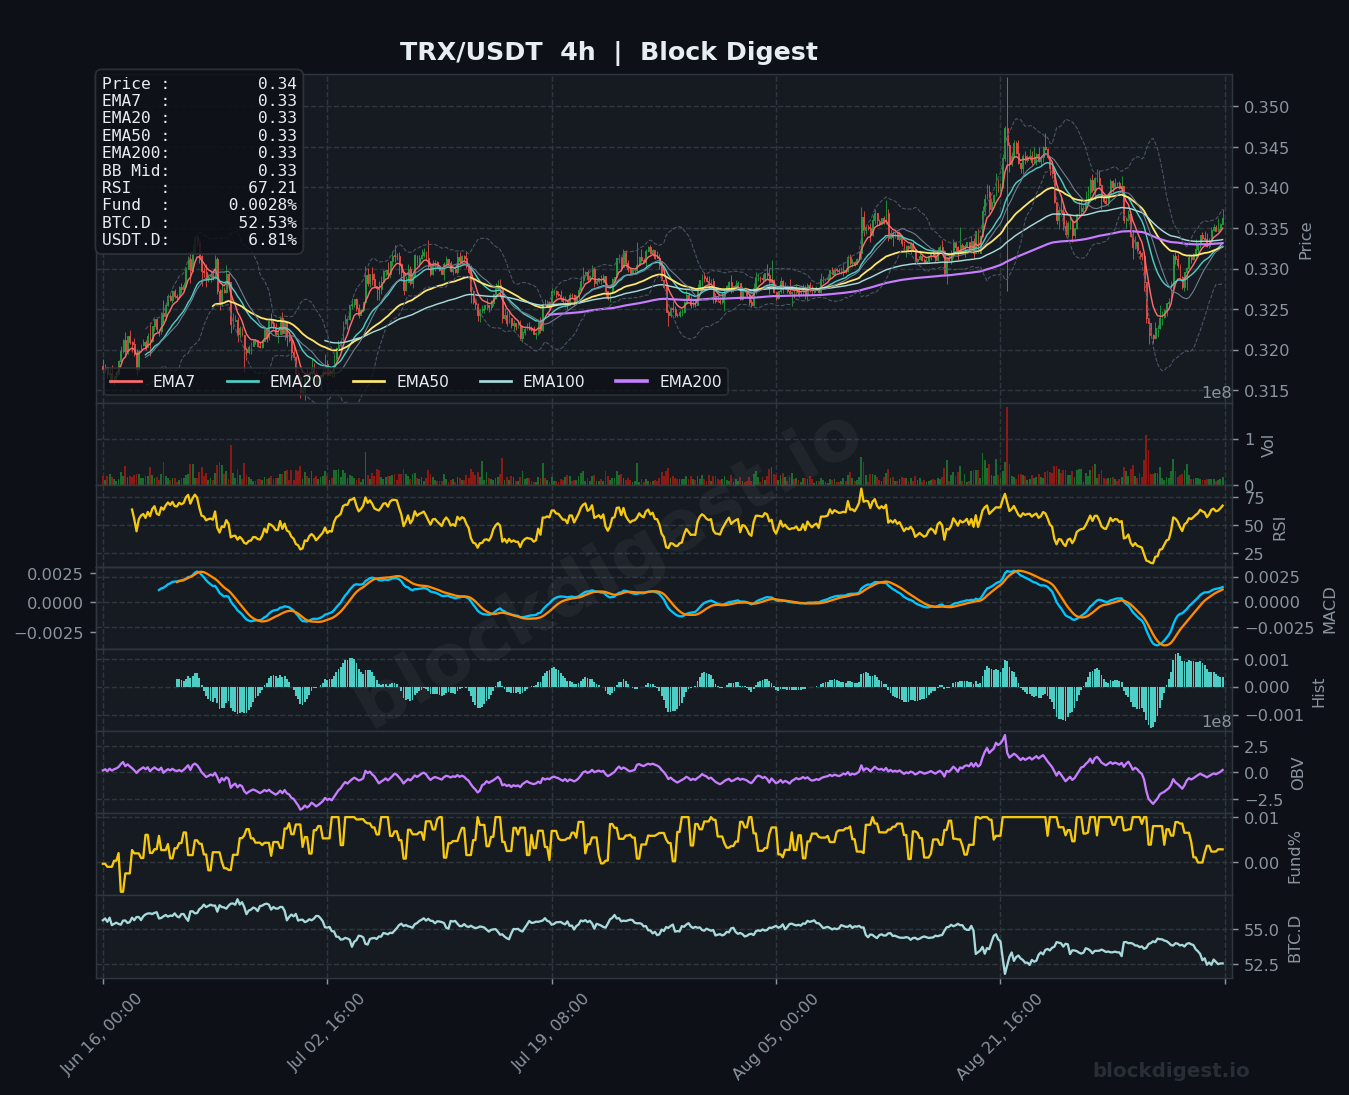
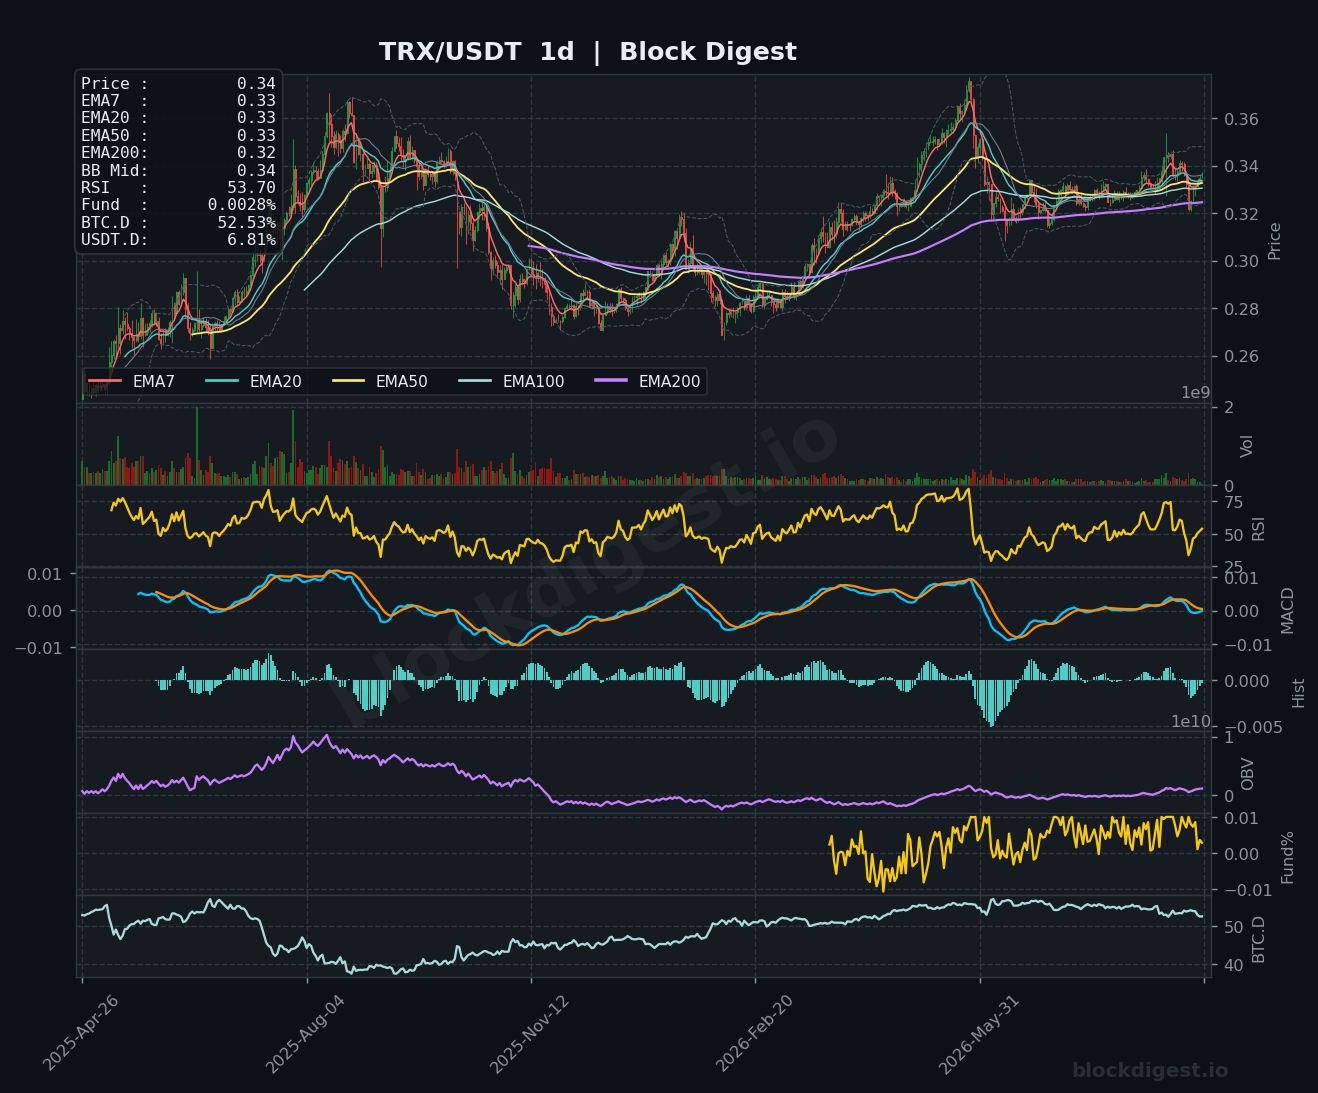
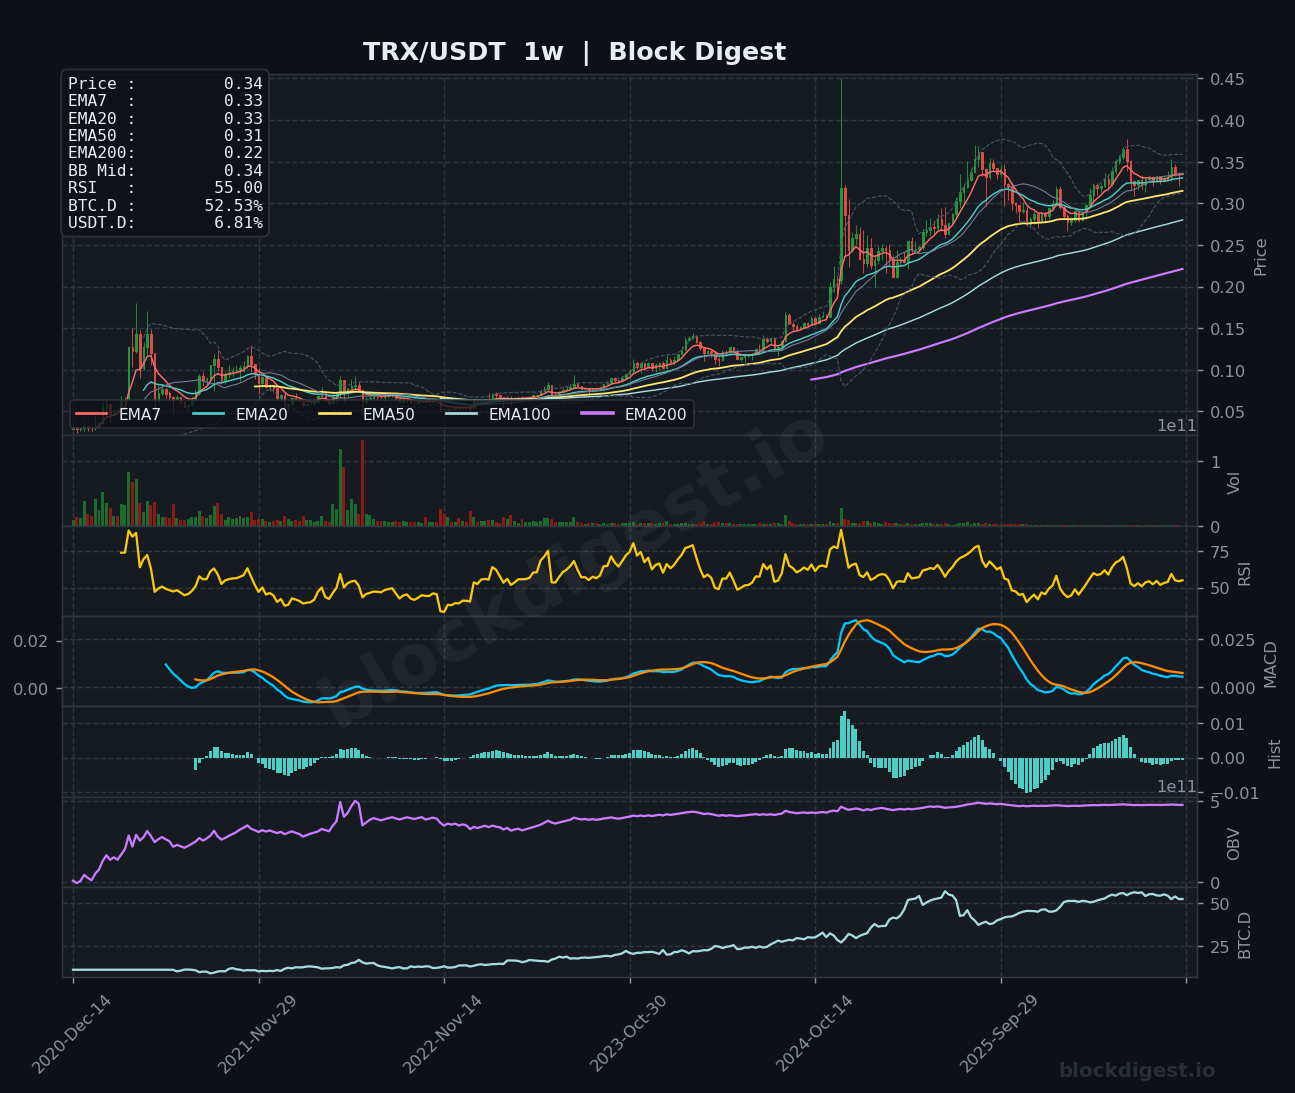
TRX has maintained a steady consolidation phase this week, hovering near the $0.3362 mark while successfully defending its position above the daily EMA50 and EMA100 levels. On the 4h timeframe, momentum is shifting toward the bulls as the RSI climbs to 67.21 and the MACD histogram flips positive, signaling a potential breakout attempt from the current Bollinger Band mid-line. While the weekly chart shows a neutral RSI at 55.00, the price remains well-supported by the rising EMA20. Watch for a decisive move above the $0.3481 daily resistance level, which would likely trigger a retest of the recent highs. If buying pressure fails to sustain, the $0.3282 support level remains the critical floor to prevent a deeper retracement.
Altcoin Outlook
Heading into next week, BNB and SOL stand out as the primary leaders, both exhibiting robust momentum and clear structural breakouts that suggest further upside potential. XRP and DOGE are showing signs of consolidation, requiring a decisive push through immediate resistance to avoid a potential retest of lower liquidity zones. Across the board, RSI compression indicates that while the market is eager to move, it is waiting for a catalyst to break the current equilibrium. Investors should prioritize assets holding above their 20-day EMAs, as these represent the most resilient setups in an otherwise overextended market environment.
Disclaimer: This analysis is for informational purposes only and does not constitute financial advice. Cryptocurrency markets are highly volatile and unpredictable. All trading decisions should be made based on your own research and risk tolerance. Block Digest is not responsible for any financial losses incurred as a result of acting on this content.