Market Context
Bitcoin dominance sits at 55.38% — a level that continues to suppress meaningful altcoin outperformance, keeping capital rotation into the broader market muted. USDT dominance at 8.05% reflects a cautious but not panicked positioning from market participants, with sidelined capital remaining elevated rather than flowing into risk assets. The Fear & Greed Index registering at 27 (Fear) reinforces the defensive tone across the altcoin space, with sellers maintaining a structural edge heading into the August 7 session.
Solana (SOL)
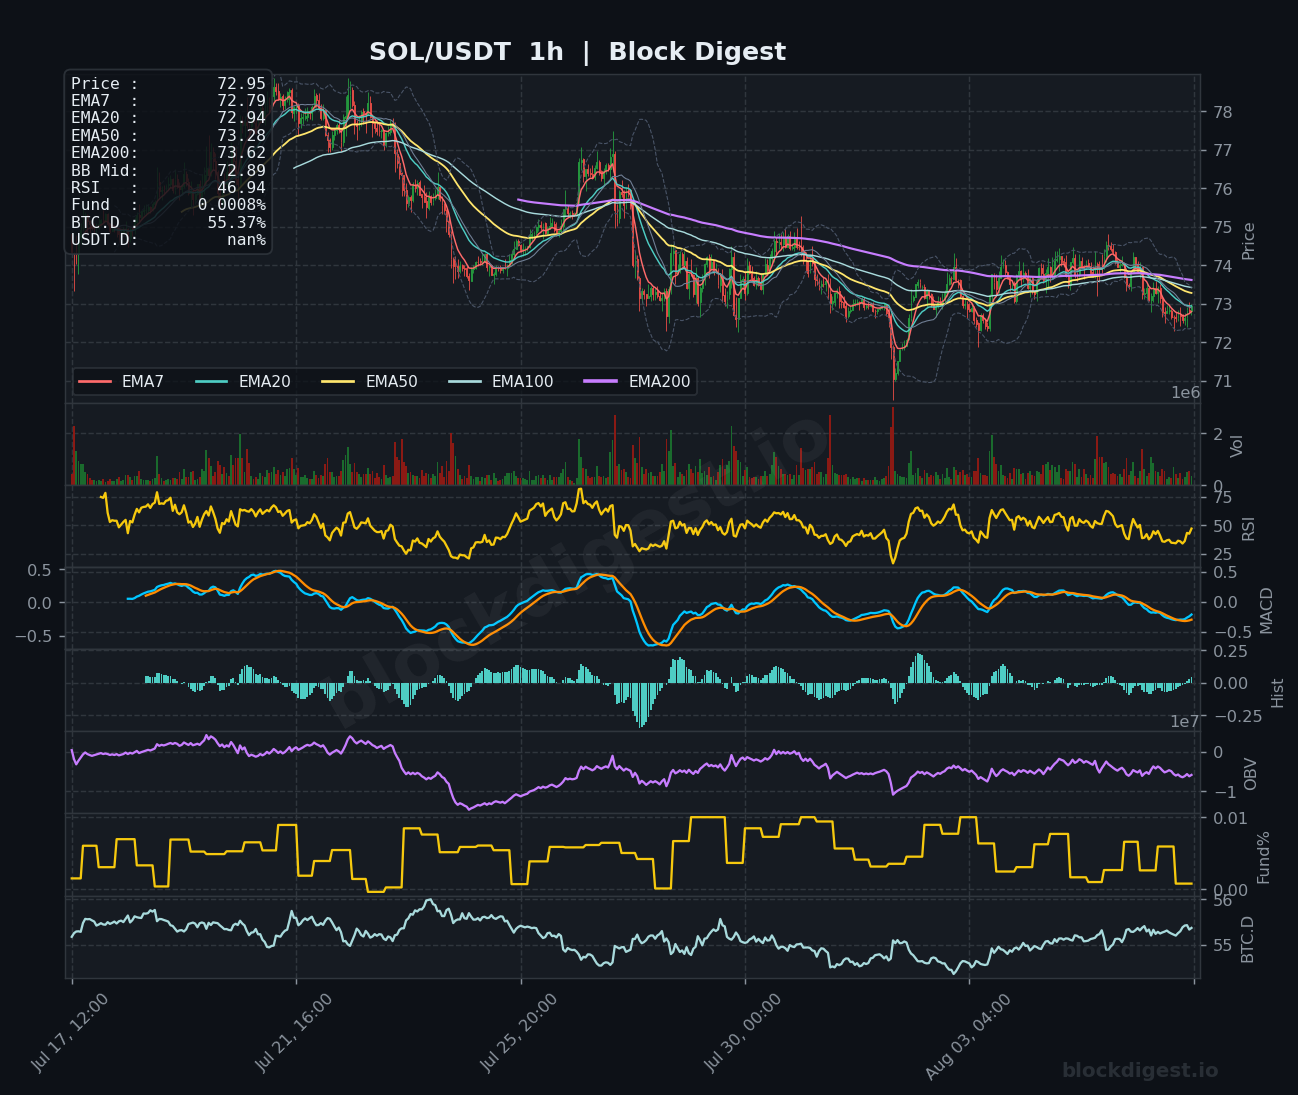
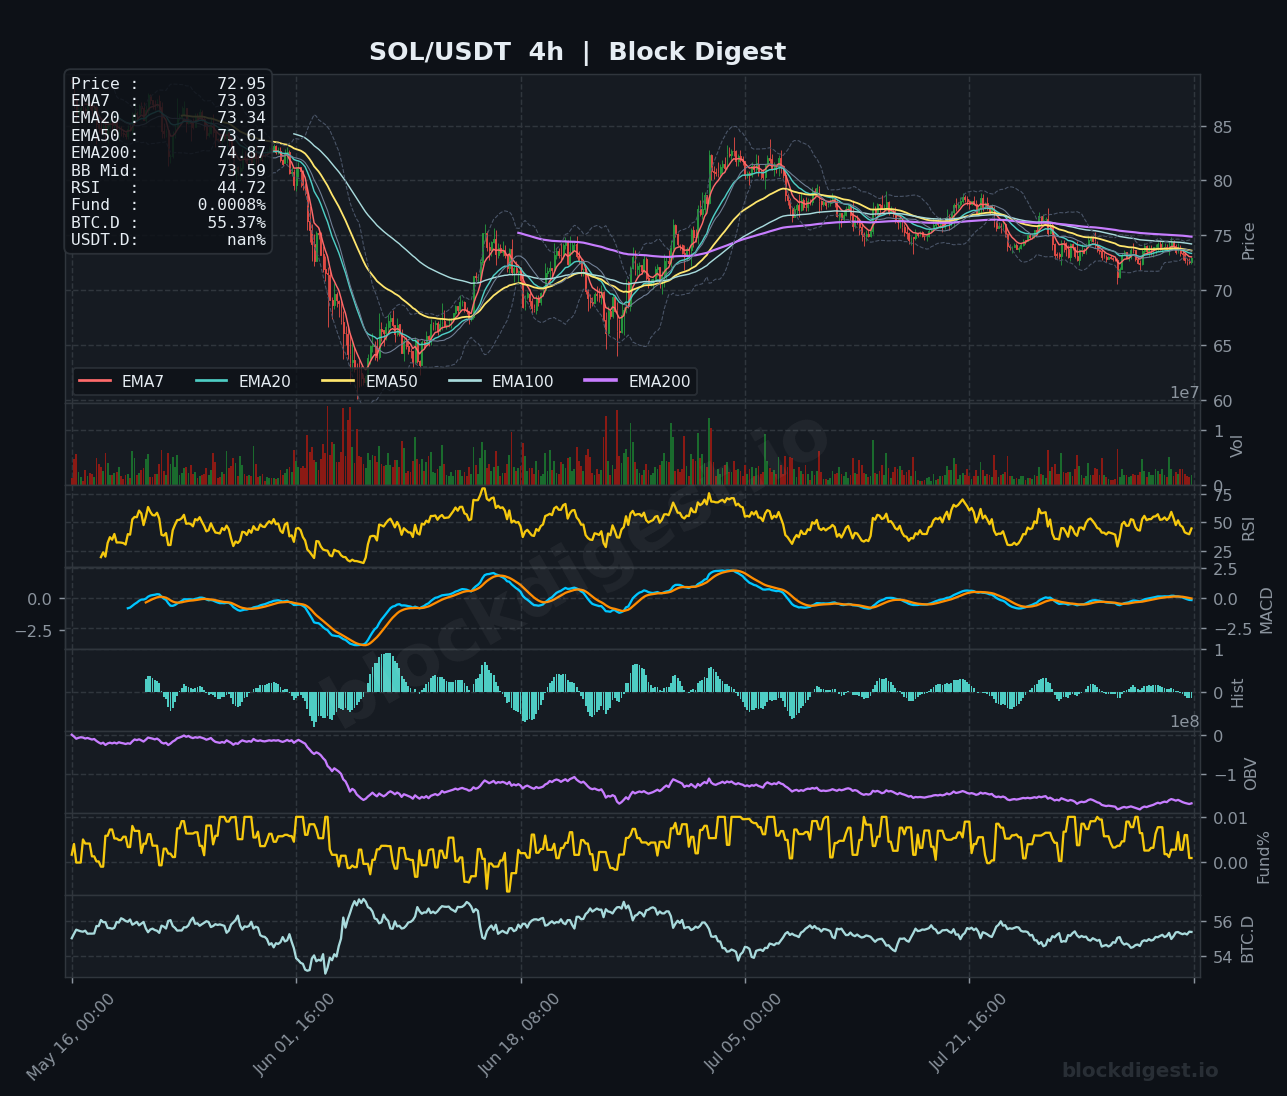
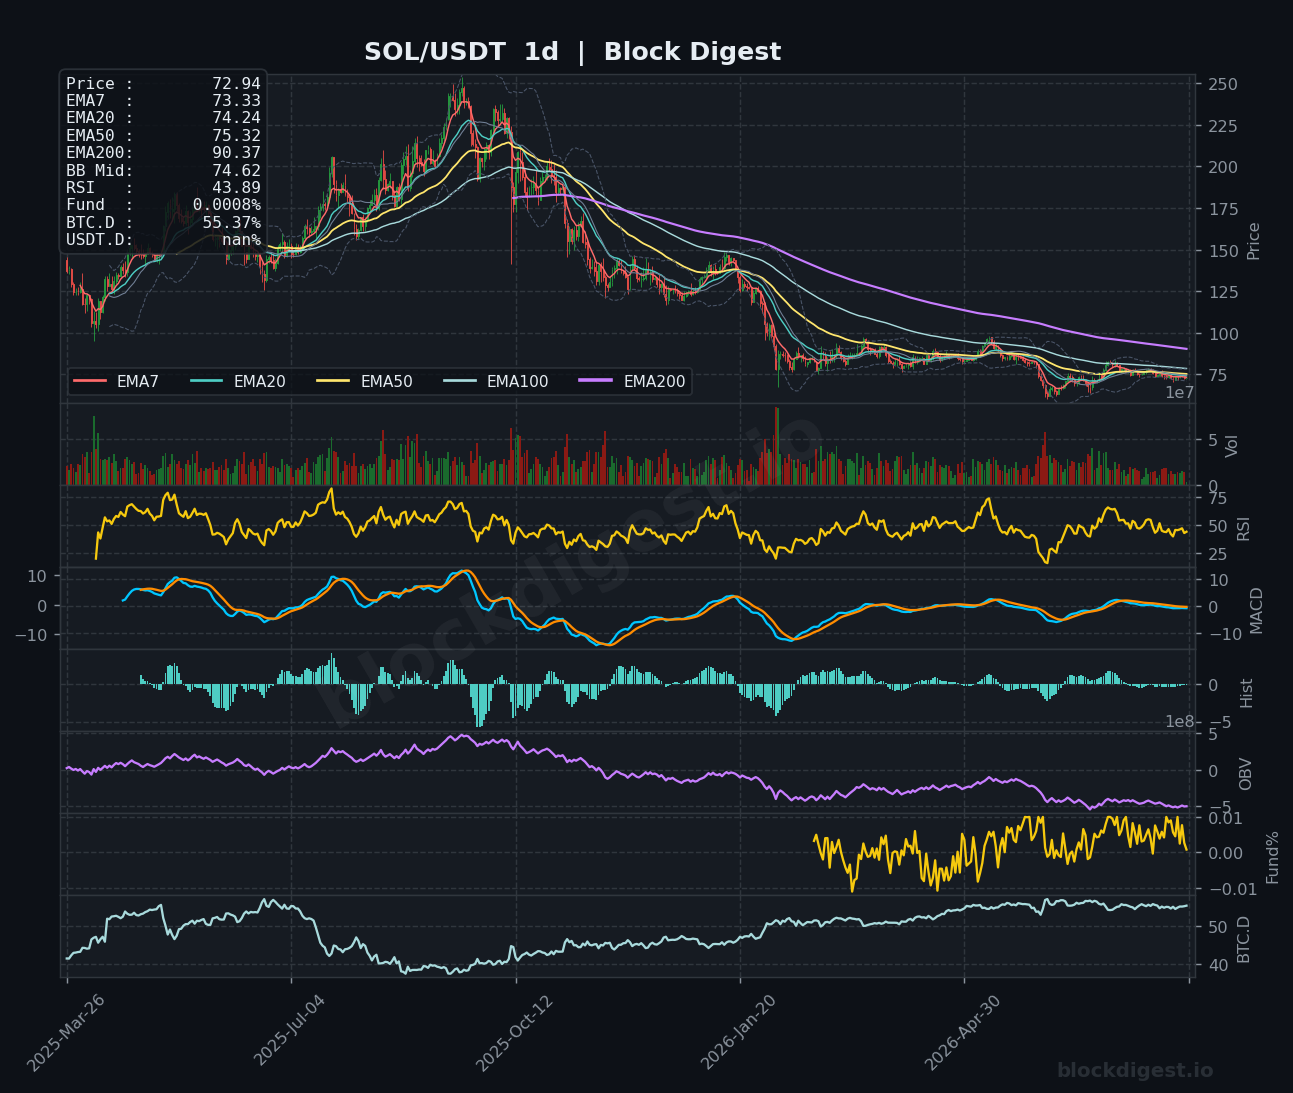
SOL is trading at $72.94–$72.95, struggling beneath a bearish EMA stack on both the 1h and 4h charts, where price sits below the EMA7, EMA20, EMA50, and EMA200 — a configuration that continues to favor sellers. The daily RSI has slipped to 43.89, reinforcing the lack of buying conviction, while the 4h MACD remains barely above zero with a flattening histogram suggesting fading bearish momentum rather than any genuine recovery. Block Digest’s BD Pulse Score of 49/100 — sitting squarely in neutral territory — aligns with the on-chain OBV trend reading of +1, indicating that while accumulation hasn’t collapsed, there’s no meaningful demand surge pushing price off current levels. Key support sits around the $71–$72 zone, with resistance clustered at the EMA50 near $73.61 on the 4h; a failure to reclaim $74 keeps the short-term bias cautiously bearish.
XRP (XRP)
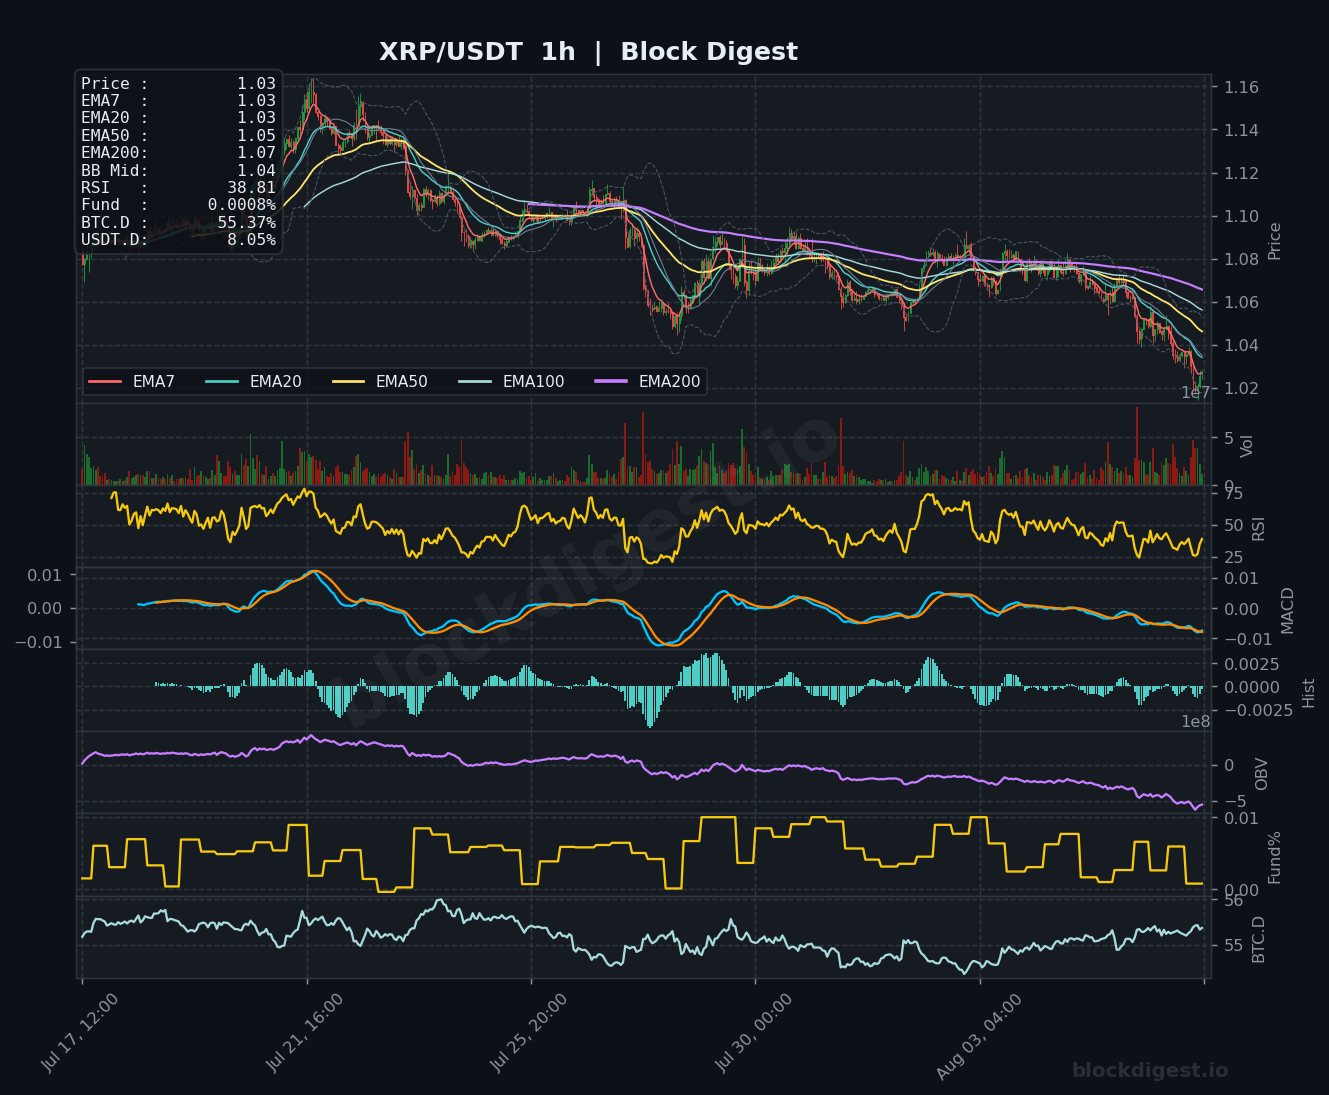
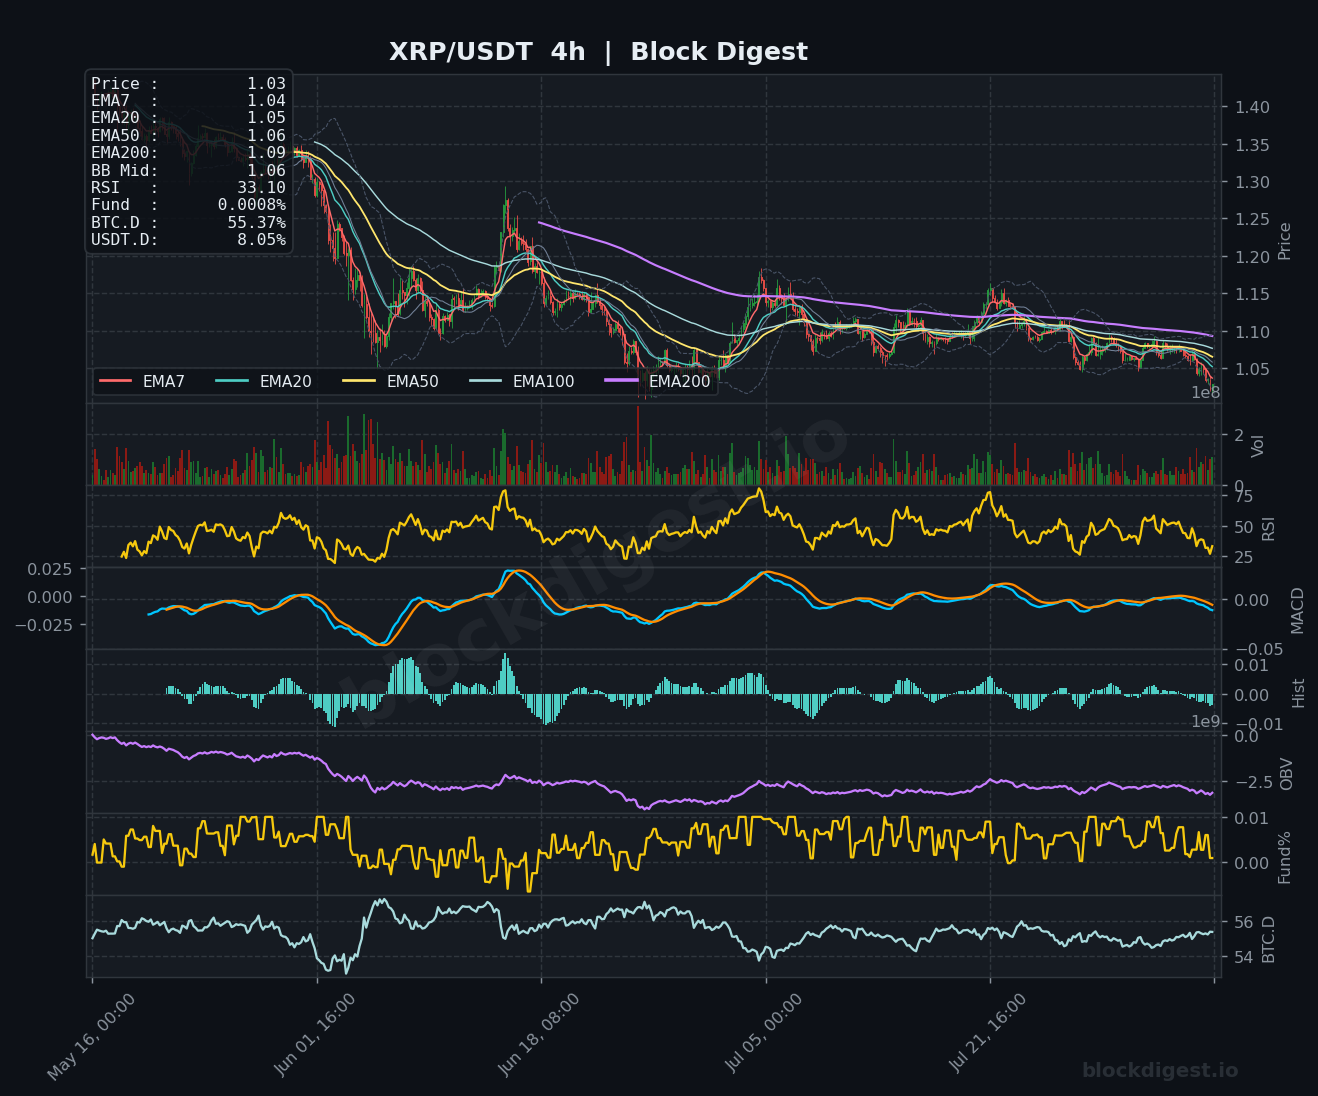
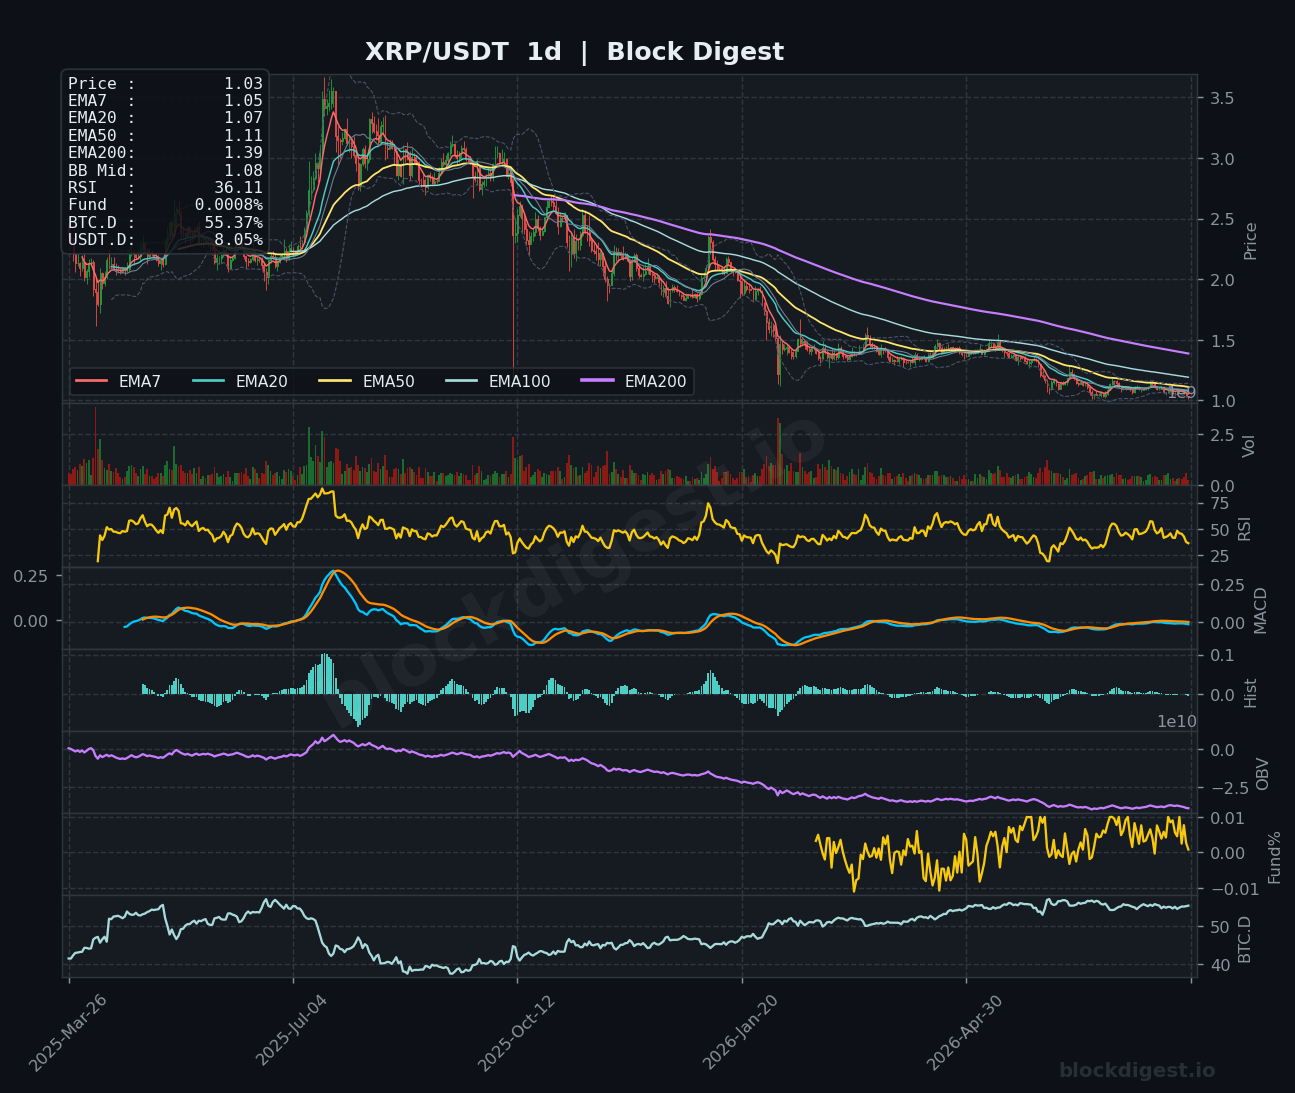
XRP is one of the weaker setups in today’s roundup, trading at $1.03 with the 4h RSI now at just 33.10 — approaching oversold territory — and the daily RSI at 36.11, reflecting a sustained period of selling pressure without a meaningful relief bounce. All short-term EMAs on both the 1h and 4h are stacked in bearish order above the current price, and the 1h OBV has been declining steadily, confirming that volume flow continues to favor distribution. The daily chart paints an even more sobering picture, with price trading well beneath the EMA200 at $1.39, which acts as a distant macro resistance ceiling. Immediate support is near the $1.00 psychological level; until XRP can reclaim the $1.05–$1.07 EMA cluster on the daily, the path of least resistance remains to the downside.
BNB (BNB)
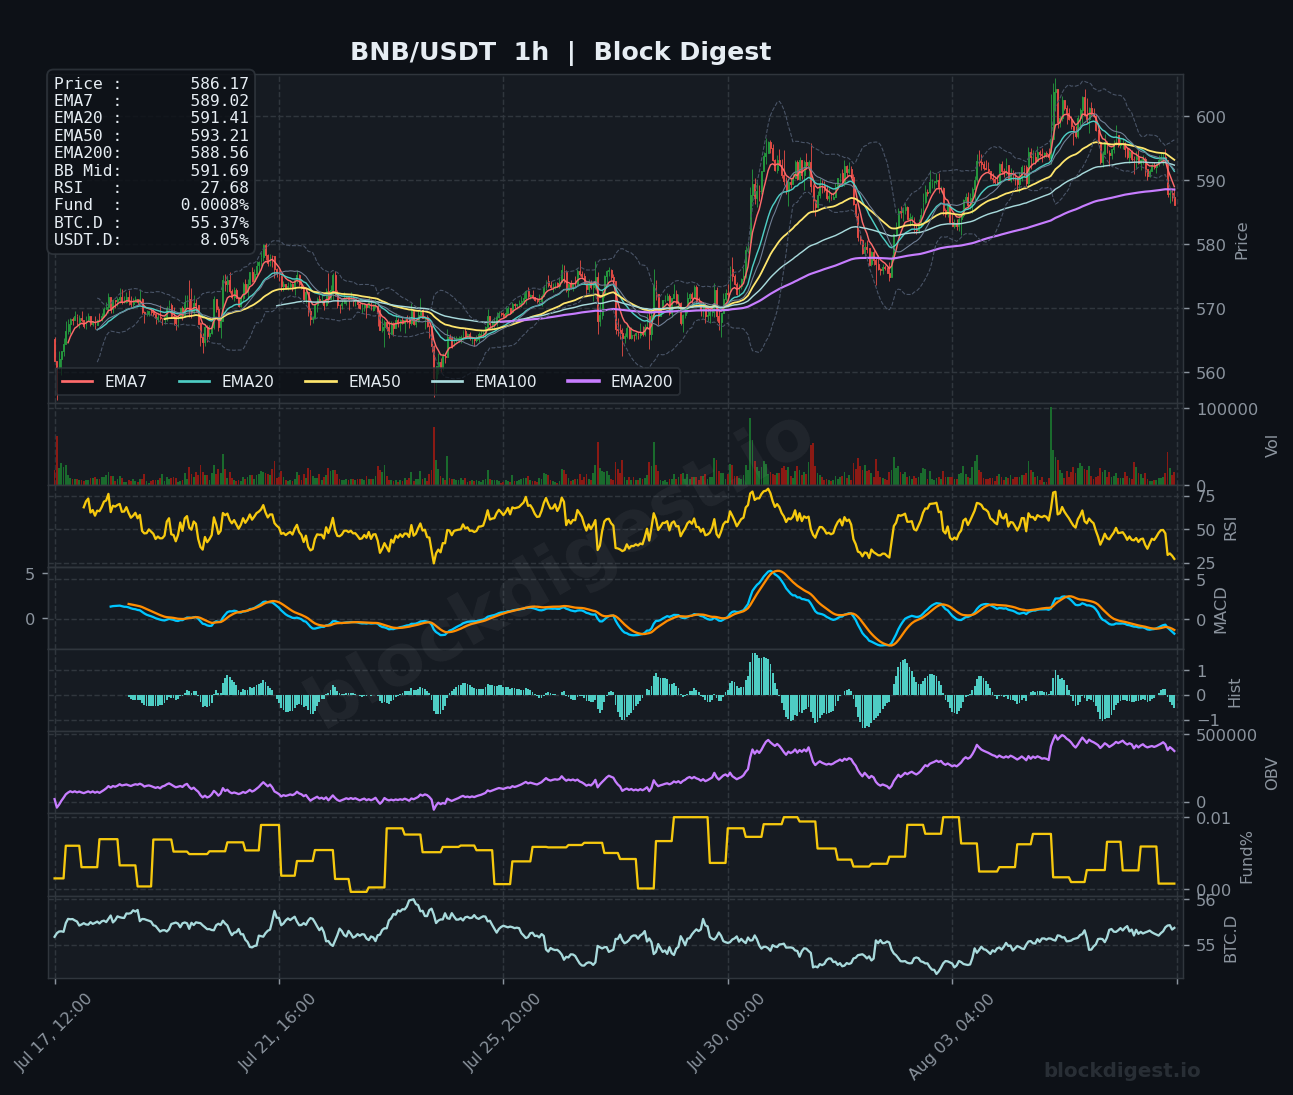
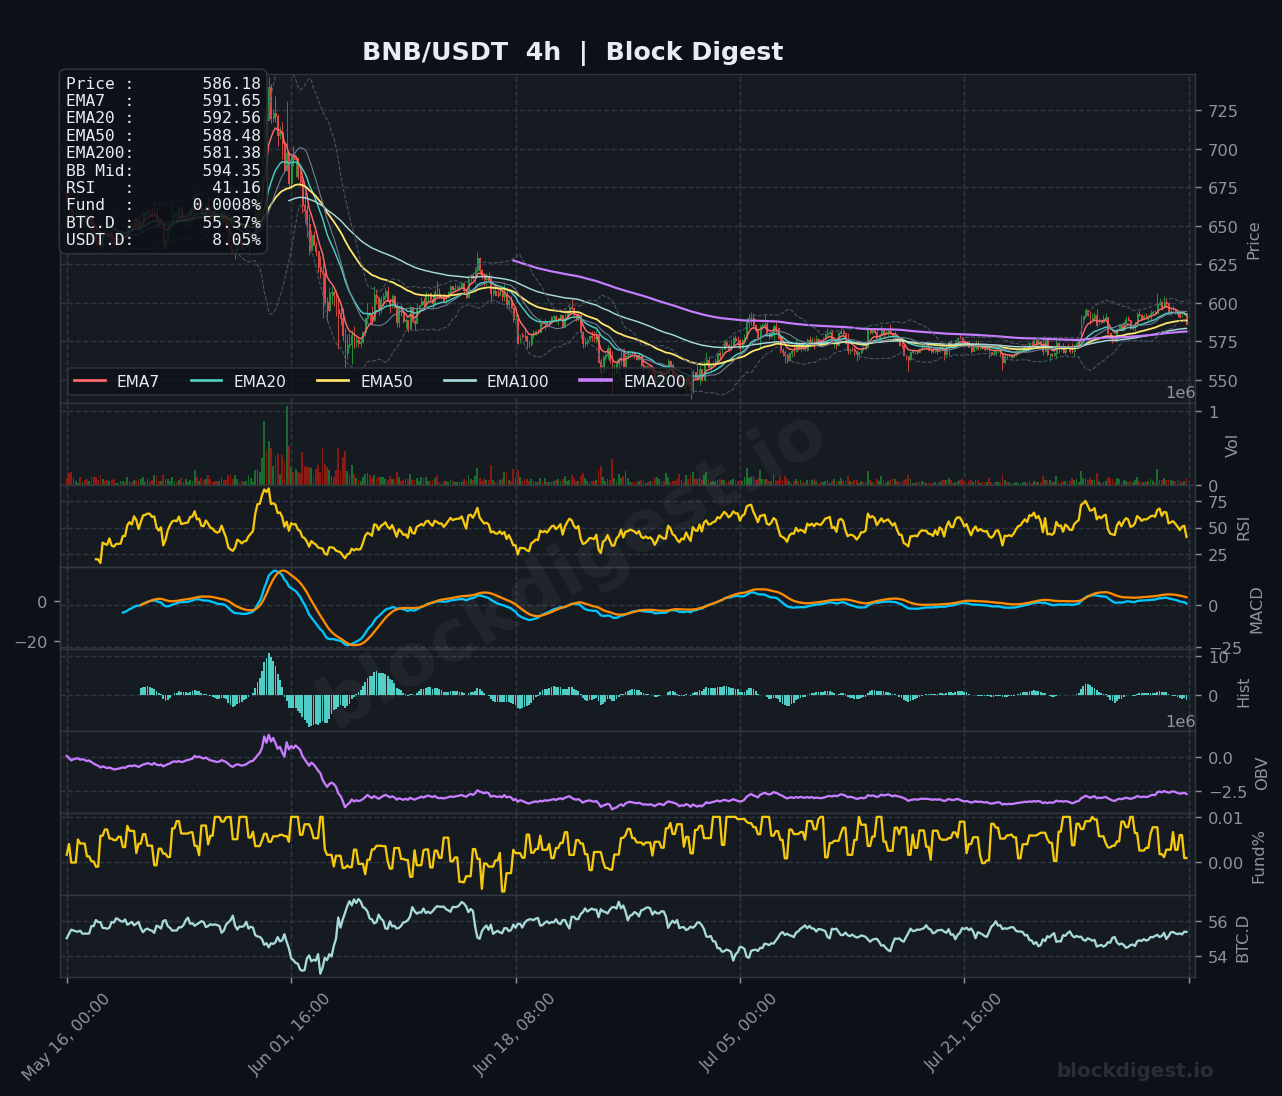
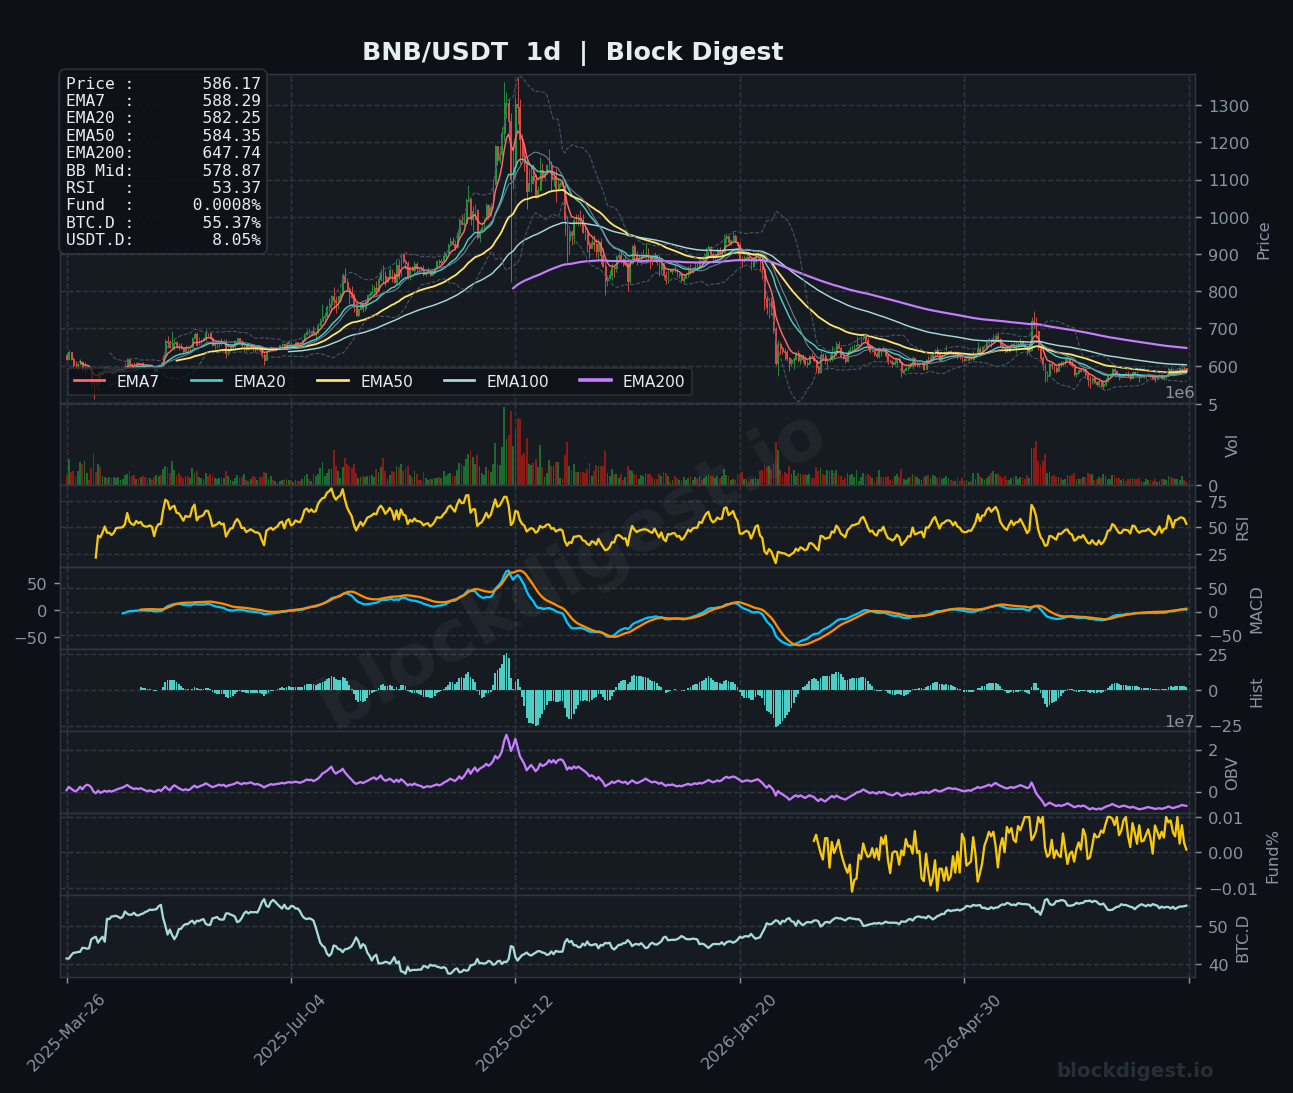
BNB presents a mixed picture relative to its altcoin peers, trading at $586.17 — the one asset in this group where the daily RSI (53.37) remains comfortably above 50, suggesting a degree of relative strength that the others currently lack. On the 1h chart, however, the RSI has dropped sharply to 27.68 following a pullback from recent highs near $600, and price has slipped beneath the EMA7 ($589.02) and EMA20 ($591.41), indicating short-term exhaustion after the recent push higher. The 4h MACD is rolling over slightly from positive territory, and the BB Mid on the 1h at $591.69 now acts as near-term resistance. With the EMA200 on the daily still at $647.74 — far above current price — the macro trend remains structurally impaired, though BNB’s ability to hold above the $580 support area and maintain a positive daily RSI reading makes it the relative outperformer among today’s six coins.
Dogecoin (DOGE)
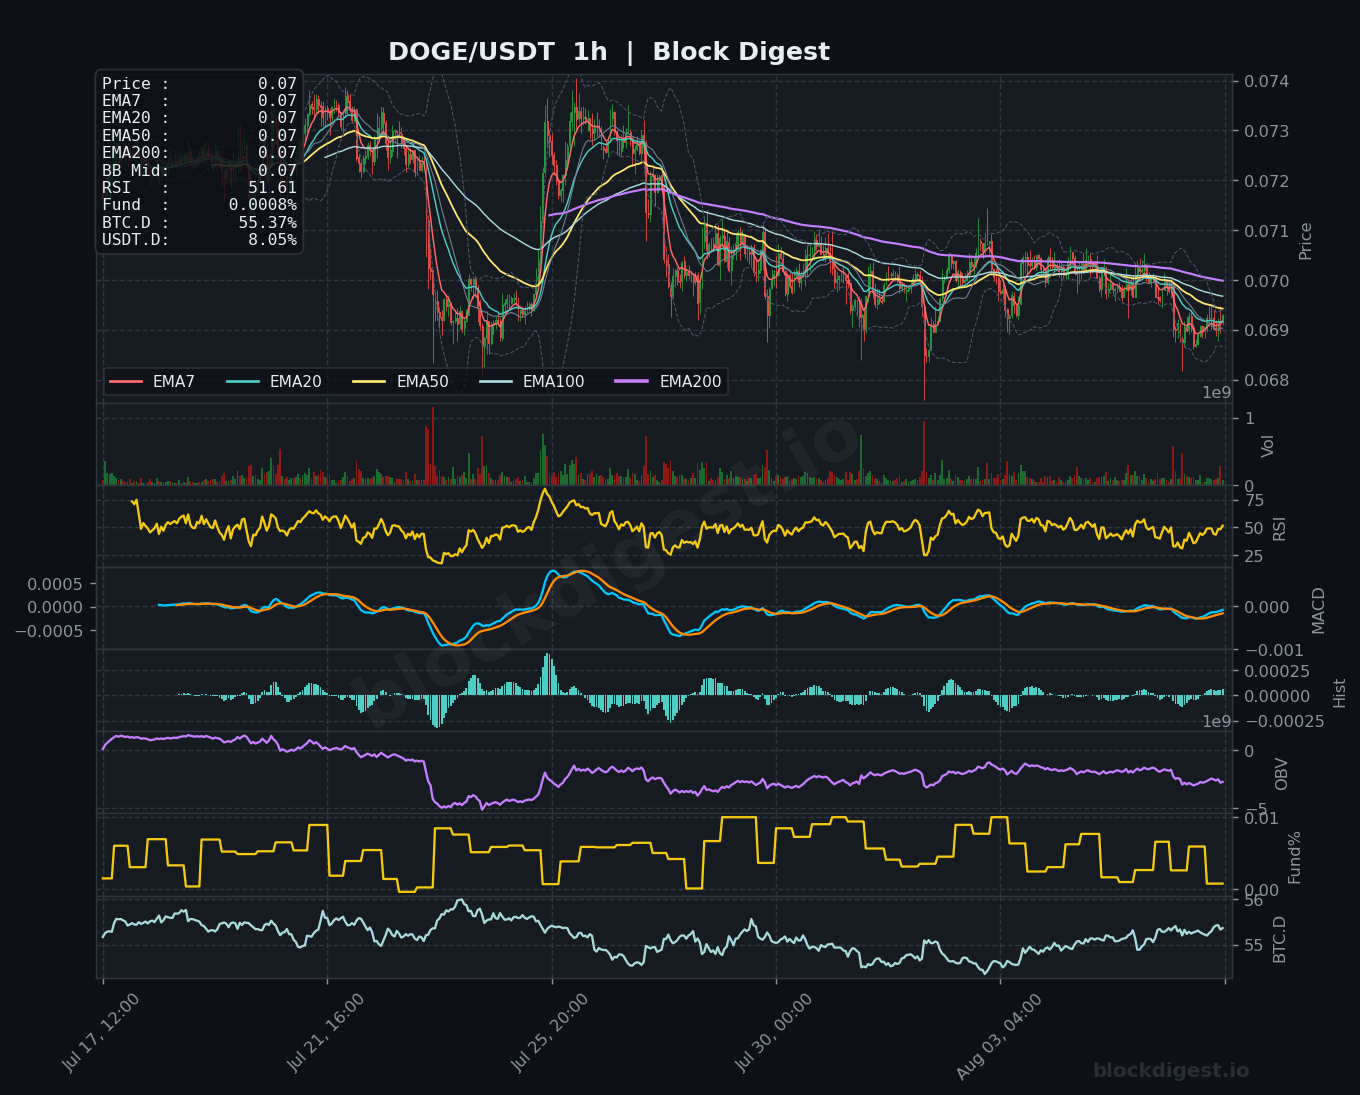
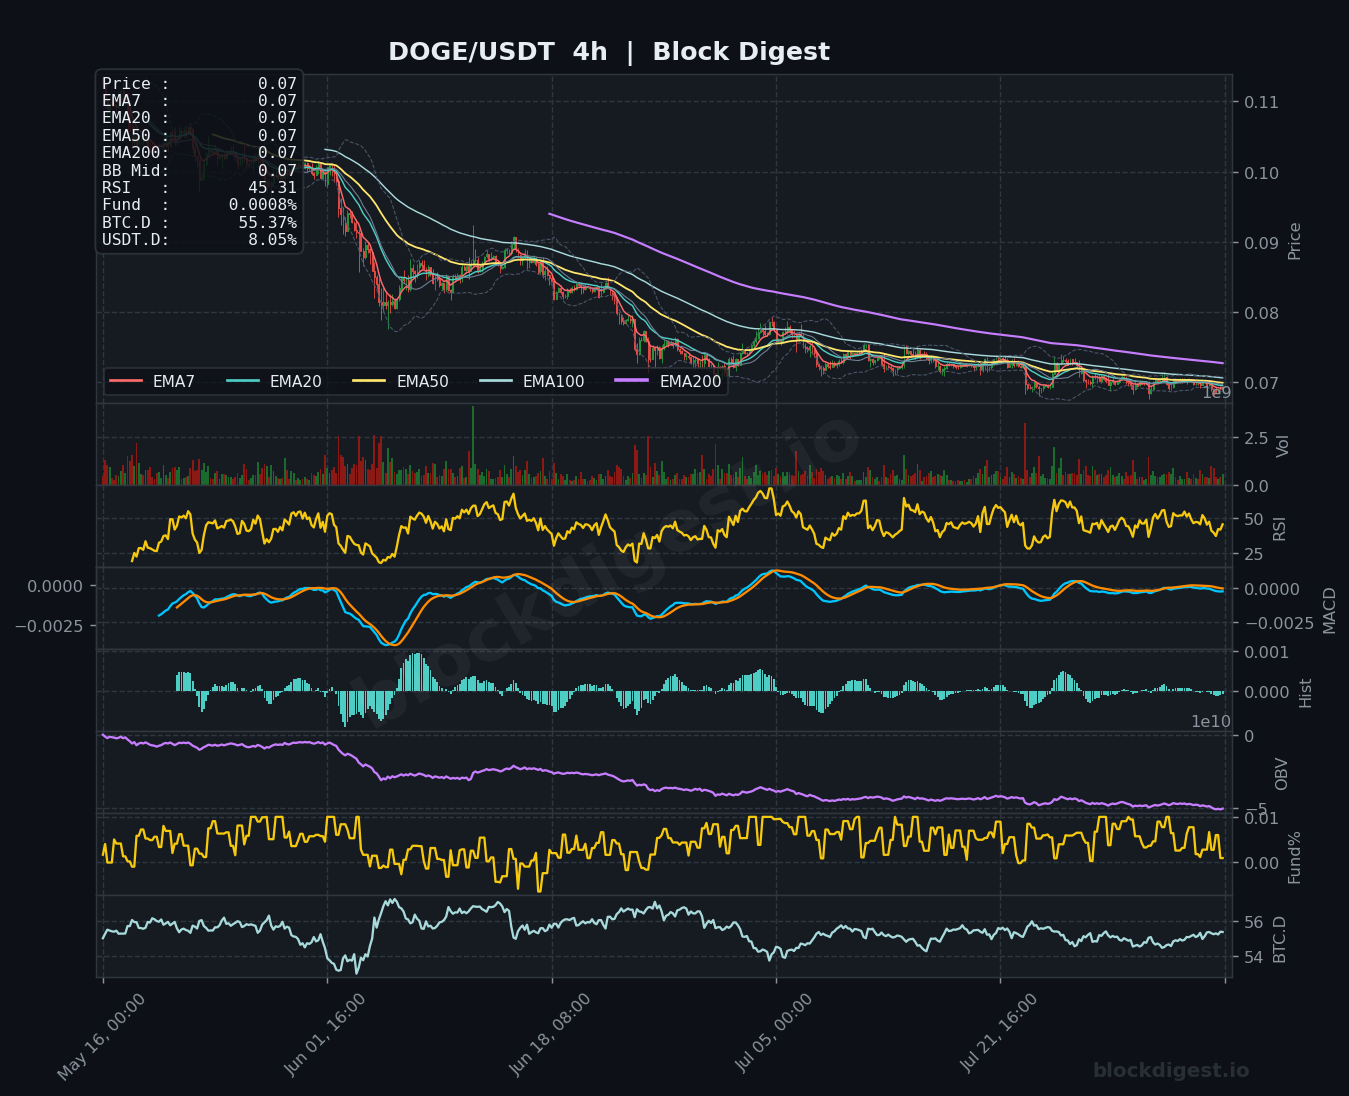
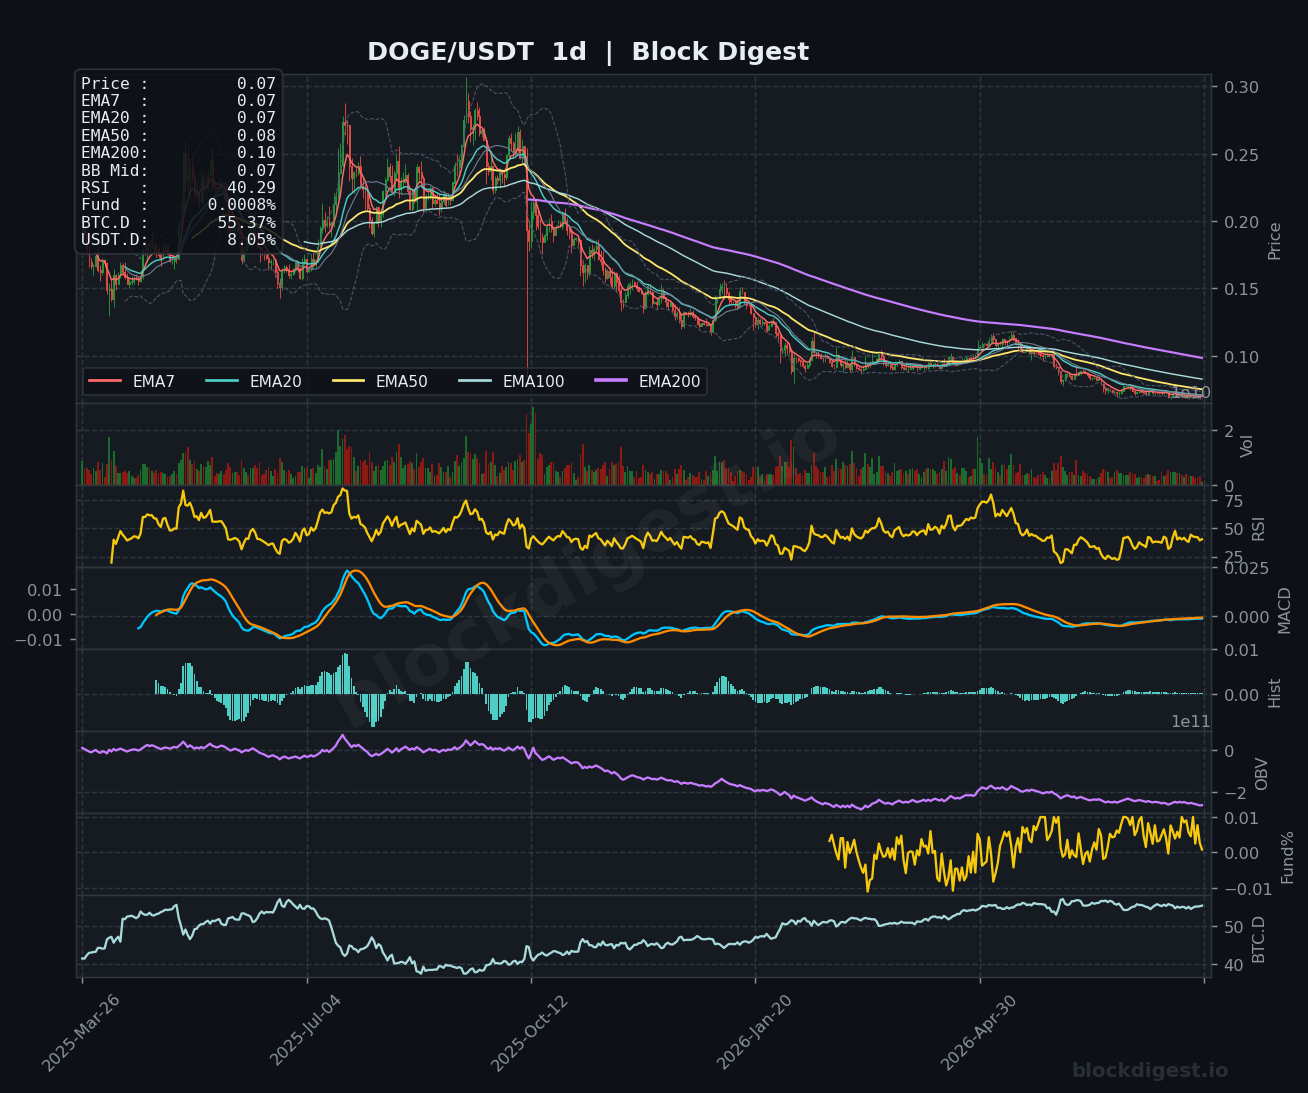
DOGE is trading at $0.069, pinned beneath a firmly bearish EMA alignment on the 4h and daily timeframes, with the EMA200 on the daily sitting all the way at $0.10 — a significant overhead barrier that underscores just how much ground has been lost over the past year. The 4h RSI at 45.31 and the daily RSI at 40.29 both sit in weak territory without showing signs of a reversal setup, while the MACD on the 4h remains flat near zero with negligible histogram momentum. The 1h RSI at 51.61 mirrors the broader BD Pulse RSI reading of 51.62, suggesting the very short-term picture is merely neutral rather than offering any directional edge. With the $0.070–$0.071 zone acting as immediate resistance and the $0.068 area as near-term support, DOGE remains trapped in a low-energy consolidation with a mild bearish lean.
Litecoin (LTC)
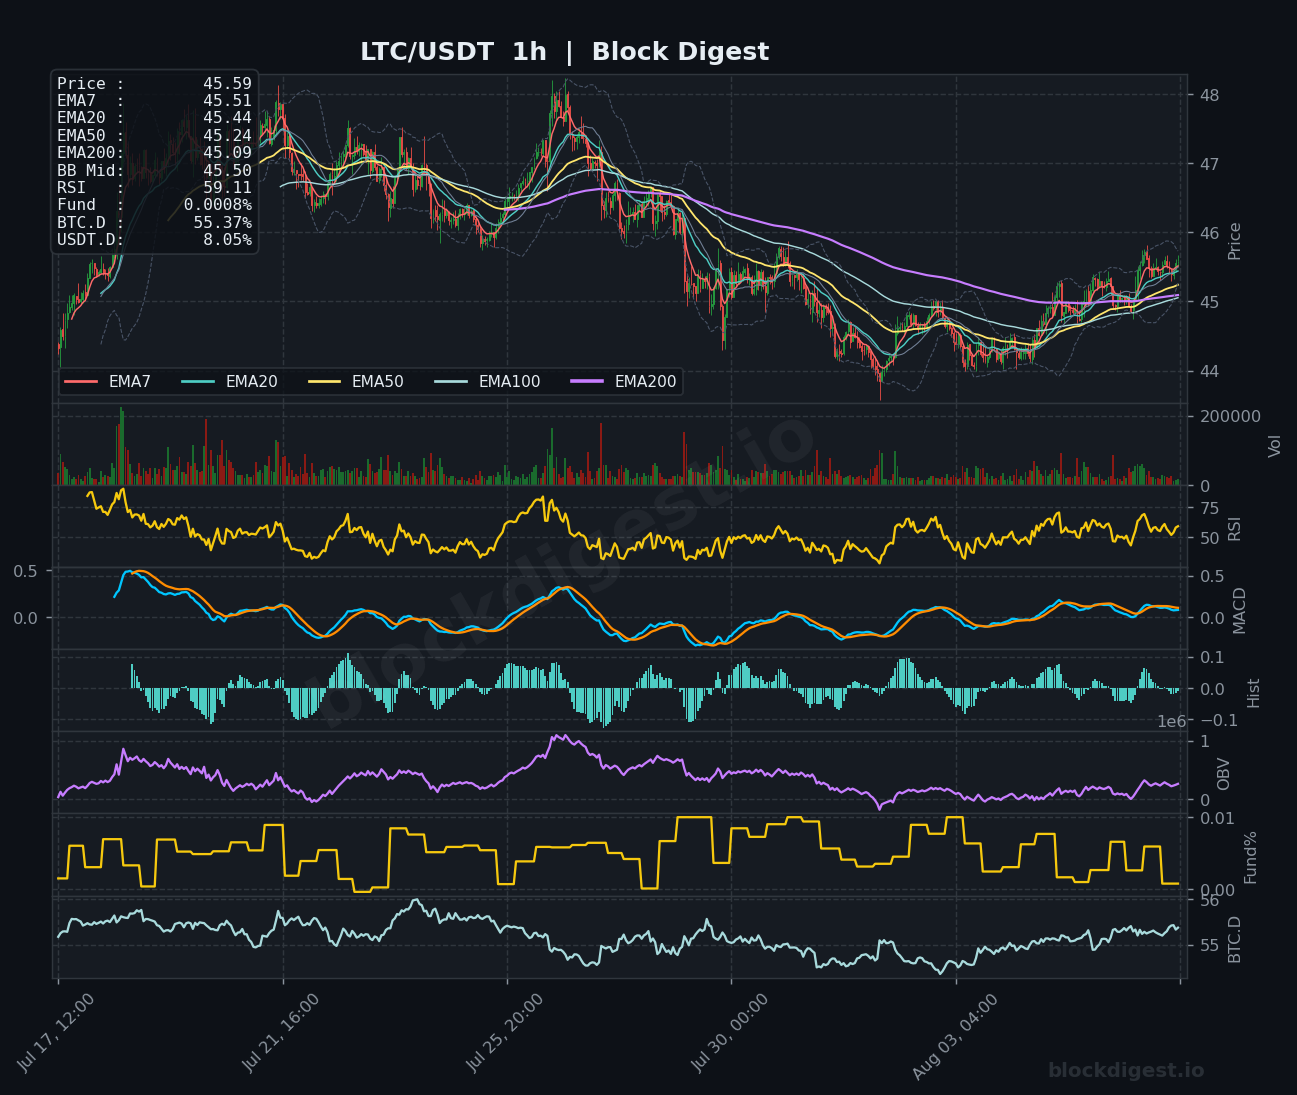
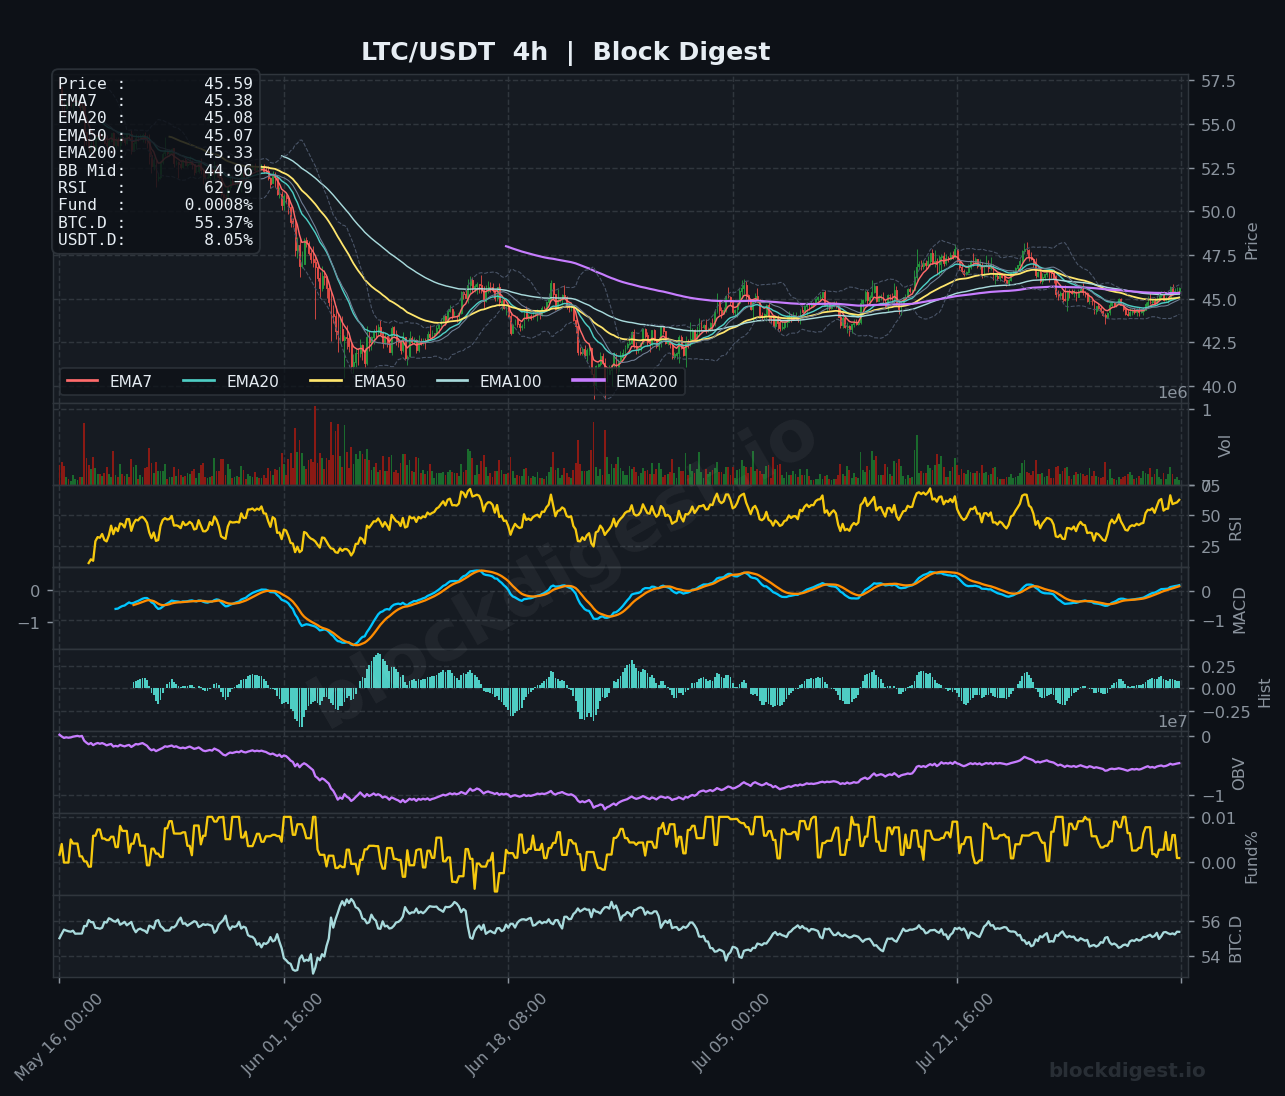
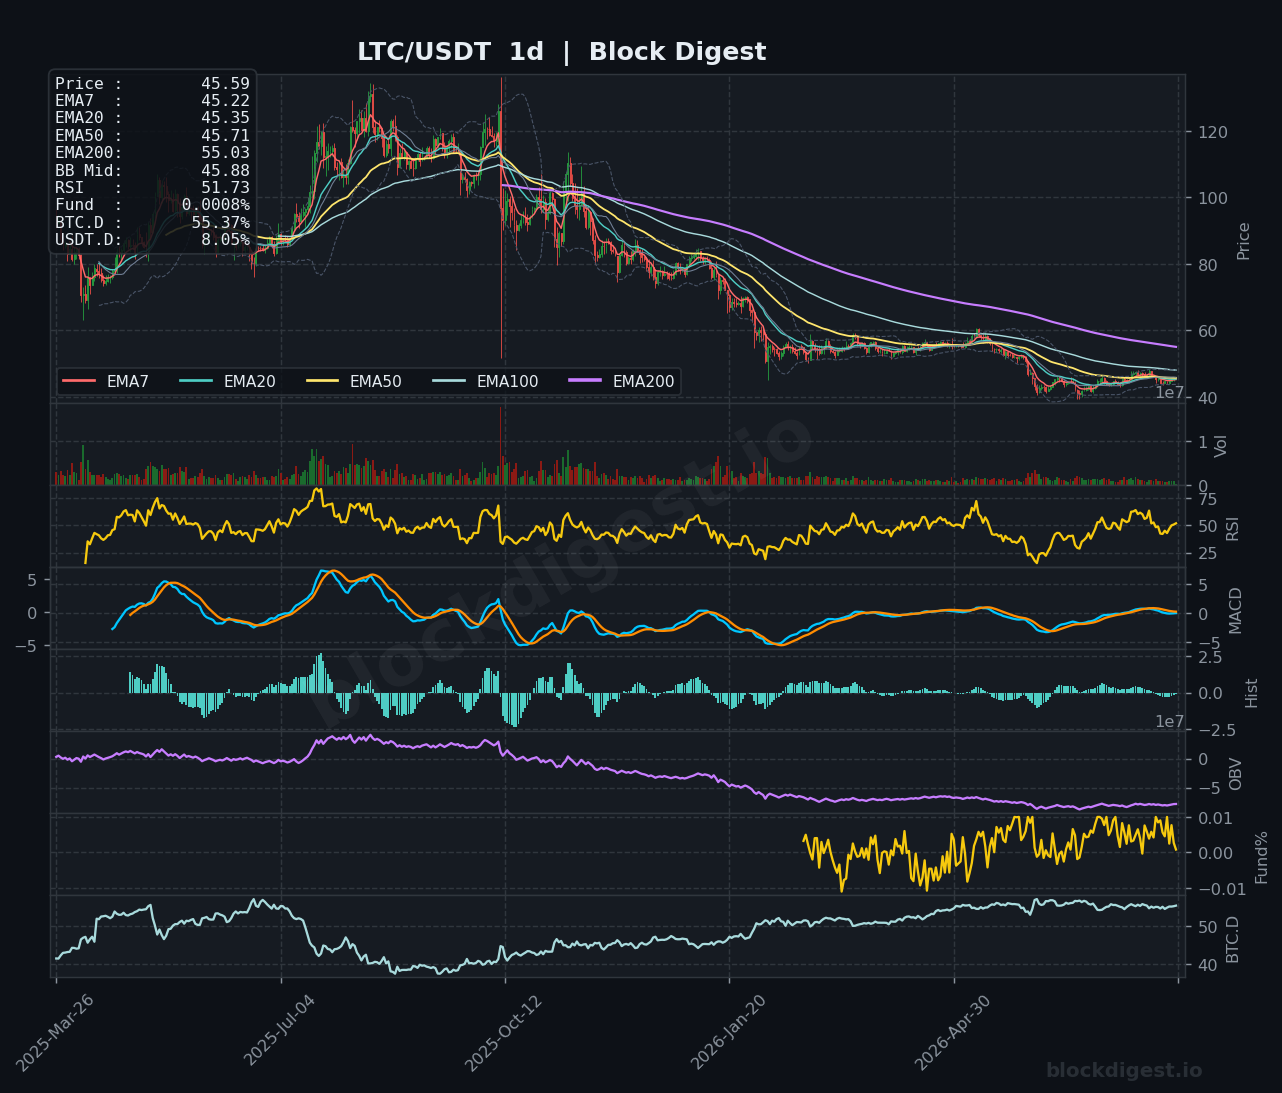
LTC is one of the more constructive short-term setups in today’s scan, trading at $45.59 with the 1h RSI at 59.11 and the 4h RSI at 62.79 — both readings showing genuine near-term momentum that stands out against the broader altcoin malaise. On the 4h chart, price has pushed above all short-term EMAs (EMA7 at $45.38, EMA20 at $45.08, EMA50 at $45.07), and the MACD is curling upward with positive histogram bars building — a constructive signal suggesting buyers are gaining traction in this timeframe. The daily picture remains structurally challenged with the EMA200 at $55.03 still acting as a formidable long-term ceiling, but the near-term recovery from the sub-$44 lows is notable. Resistance is clustered at $46.50–$47.50, while support rests at the 4h EMA cluster near $45.00–$45.10; a hold above this zone keeps the short-term bias modestly bullish.
TRON (TRX)
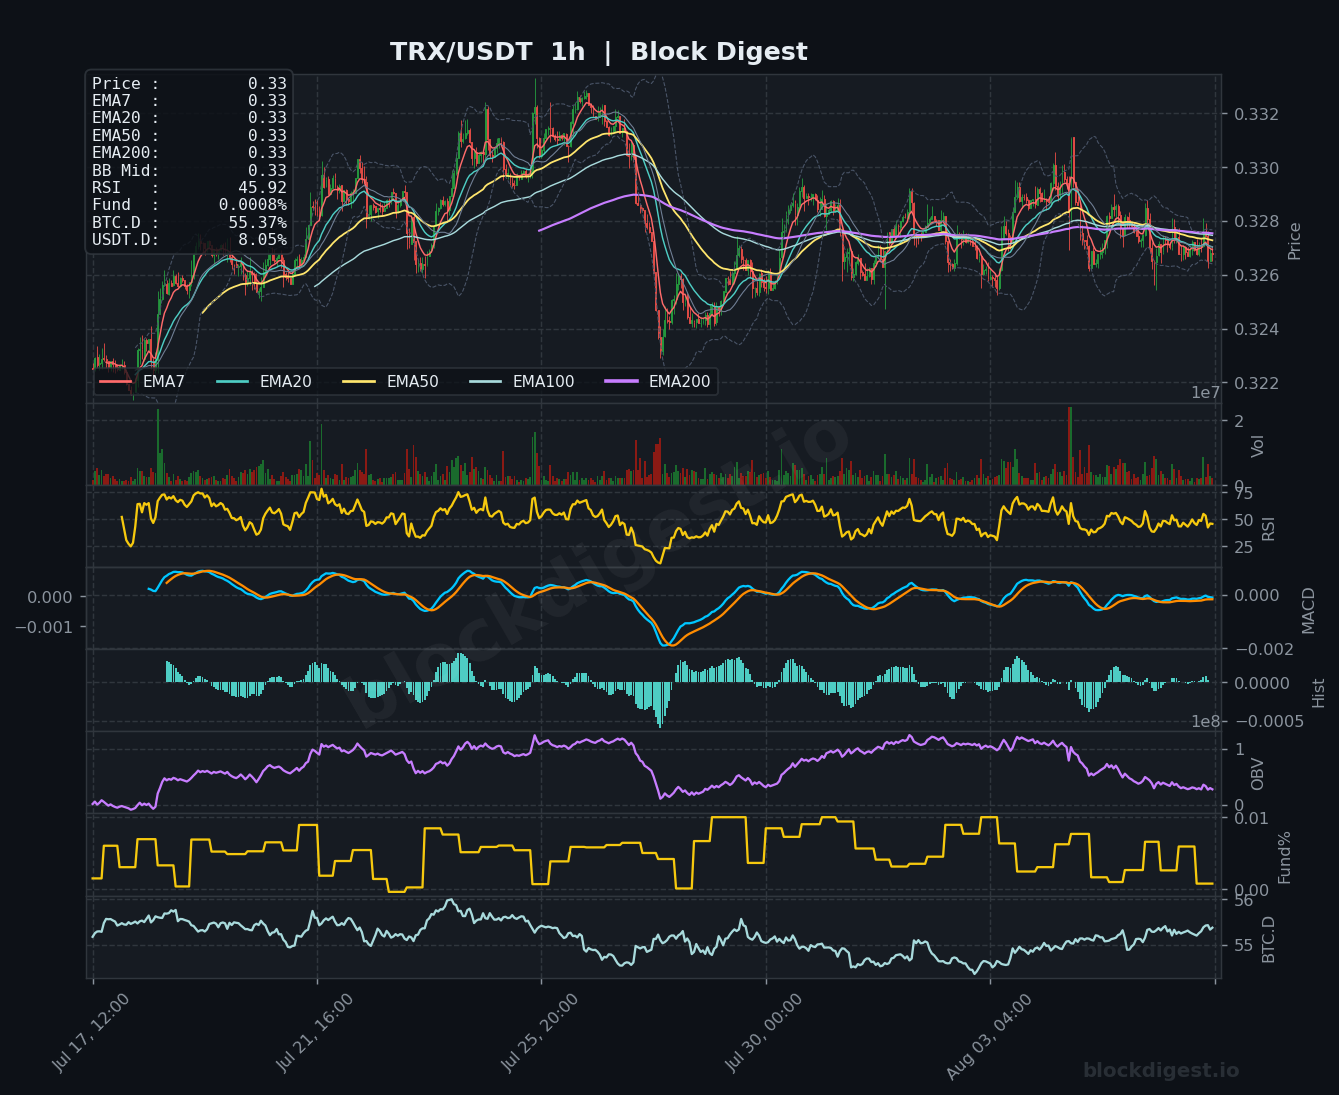
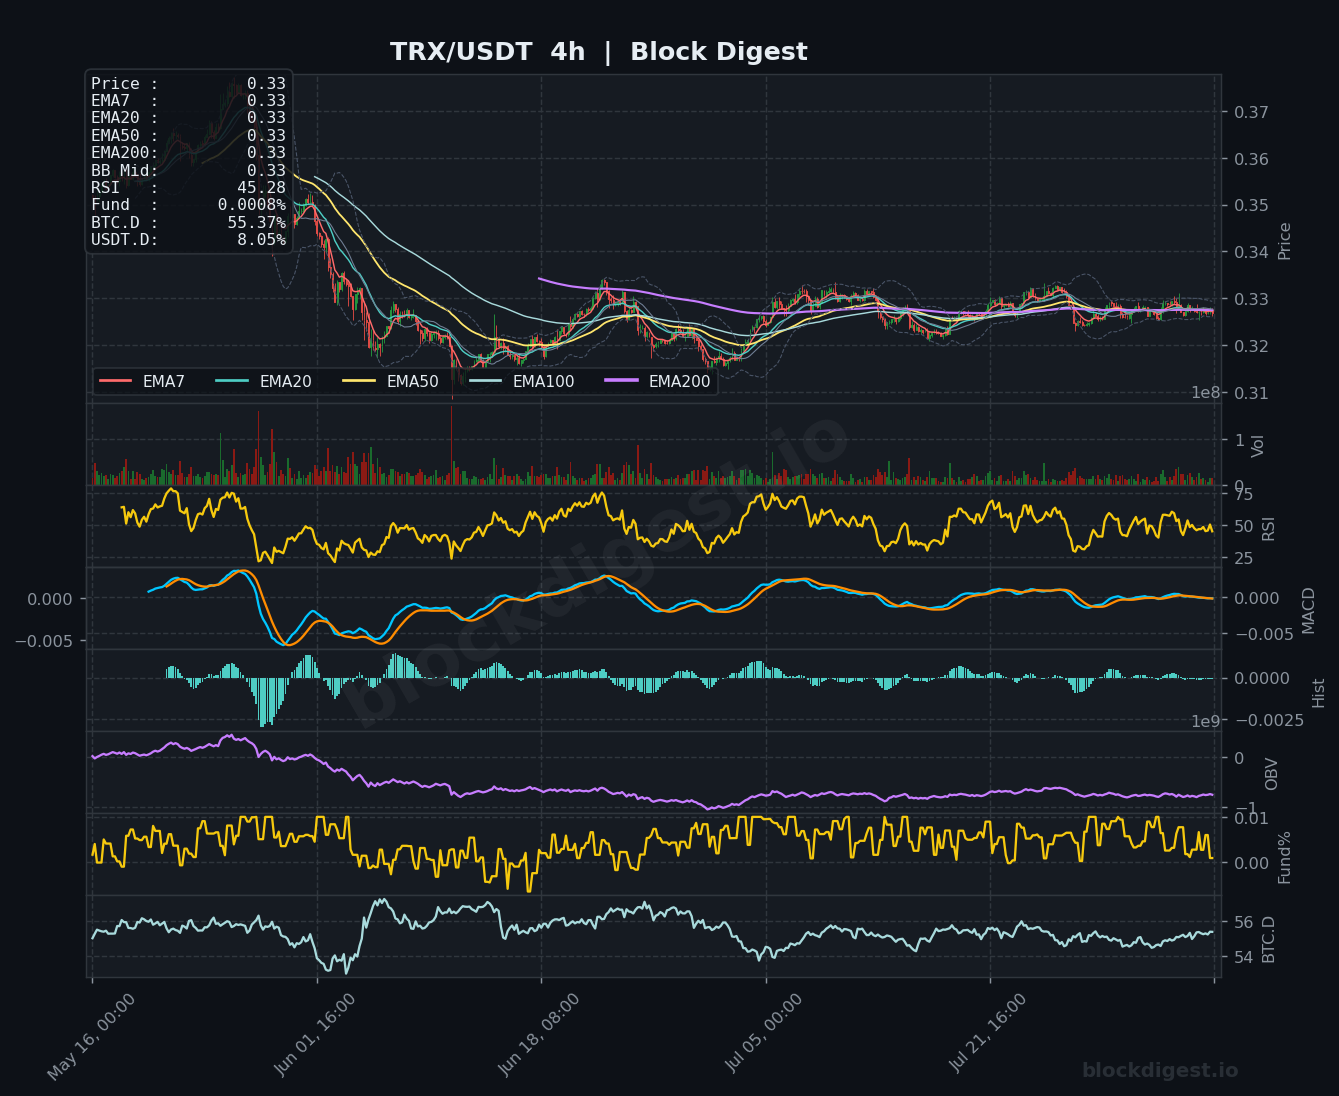
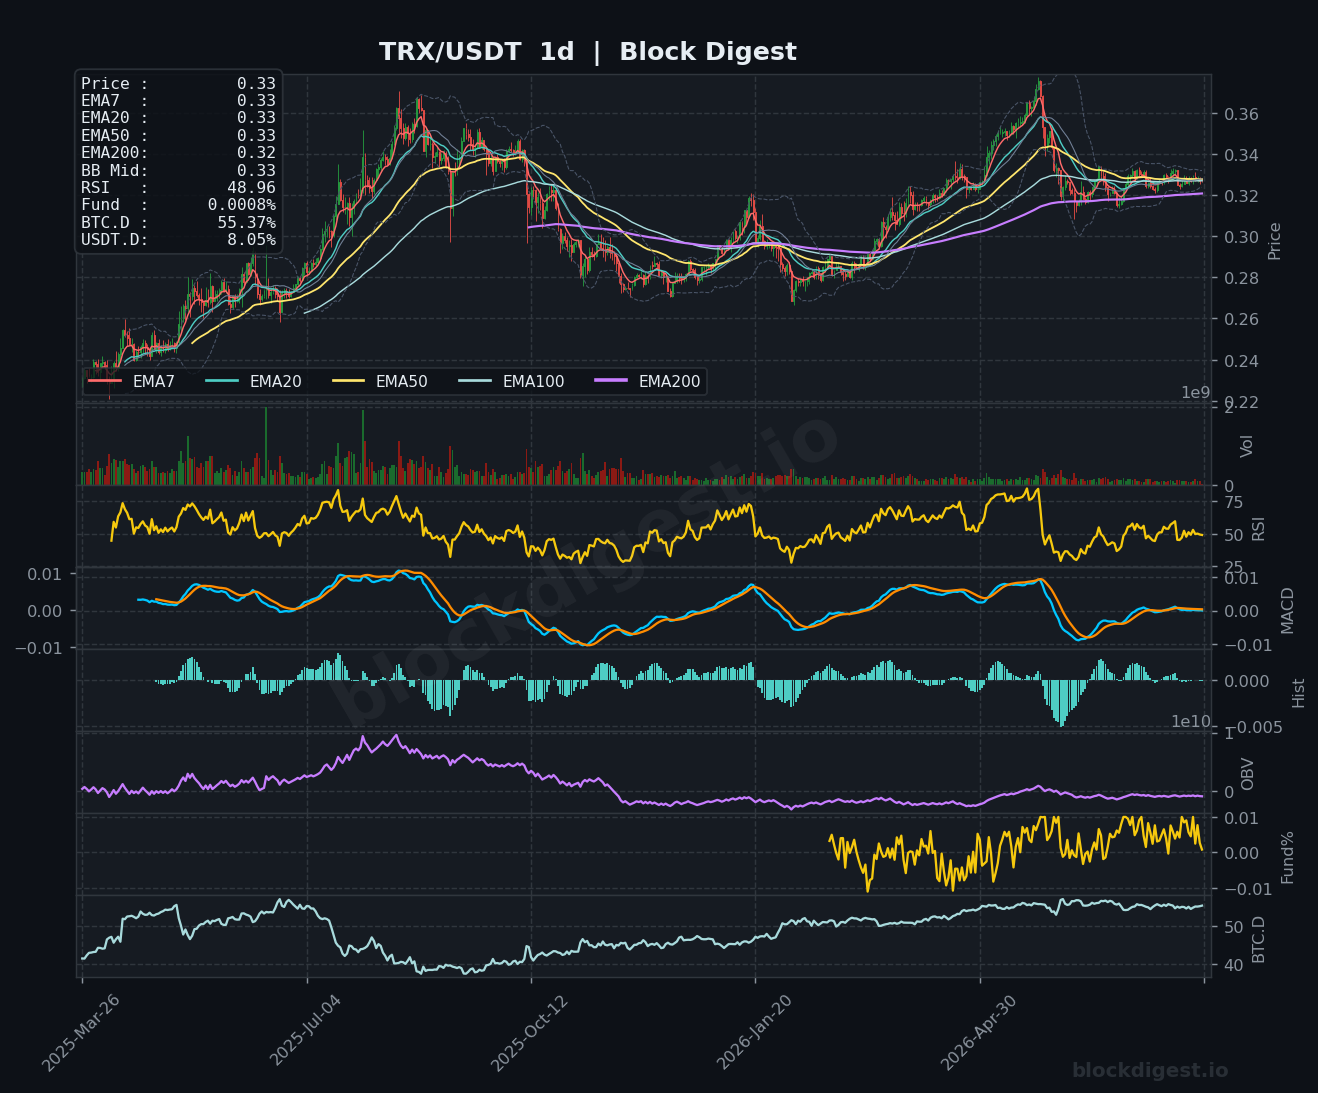
TRX is trading at $0.328–$0.33, exhibiting the tightest price range of all six coins covered today, with all EMAs on both the 1h and 4h essentially flat and converged — a textbook low-volatility squeeze that typically precedes a directional move. The 1h RSI at 45.92 and the 4h RSI at 45.28 both sit just below the neutral 50 mark, while the MACD on both timeframes hovers near the zero line with minimal histogram divergence, offering no clear directional conviction. On the daily chart, RSI at 48.96 keeps TRX in a similar limbo, though notably the daily EMA200 at $0.32 provides a mild structural floor — one of the few coins in this group where price is not dramatically below its long-term moving average. The $0.326 area marks key near-term support, with $0.332–$0.334 acting as resistance; absent a broader market catalyst, TRX looks set to continue grinding sideways with a slight bearish tilt.
Altcoin Outlook
The overall altcoin setup for August 7 is one of broad consolidation under bearish structural pressure, with BTC dominance at 55.38% and the BD Extreme Index sitting at a benign +0.80σ collectively signaling that no explosive altcoin move is imminent in either direction. LTC stands out as the strongest short-term setup with elevated RSI readings on the 1h and 4h and a recovering EMA structure, while XRP and DOGE present the weakest configurations — both grinding lower with RSIs deep in bearish territory across multiple timeframes. BNB shows relative resilience on the daily but faces near-term distribution pressure after its recent spike toward $600. The key condition to watch across the space is whether BTC dominance begins to roll over from the 55%+ zone — any sustained decline there would be the primary unlock for altcoin capital rotation, but until that shift materializes, patience and selectivity remain the appropriate posture.
—
Disclaimer: This analysis is for informational purposes only and does not constitute financial advice. Cryptocurrency markets are highly volatile and unpredictable. All trading decisions should be made based on your own research and risk tolerance. Block Digest is not responsible for any financial losses incurred as a result of acting on this content.
Stay Ahead of the Market
Follow BlockDigest for crypto market intelligence, research and real-time updates.