Market Context
The altcoin market is navigating a broadly defensive environment as BTC dominance holds at 54.64% — a level that continues to siphon capital away from lower-cap assets and suppress meaningful altcoin momentum. USDT.D sitting at 8.11% signals that a non-trivial amount of capital remains parked on the sidelines, reflecting lingering risk-off sentiment following July’s broad-market correction. Our BD Pulse Score of 41/100 corroborates this cautious backdrop: conditions are technically bearish, and with an OBV trend reading of -1, overall accumulation pressure across the altcoin space remains weak heading into August.
Solana (SOL)
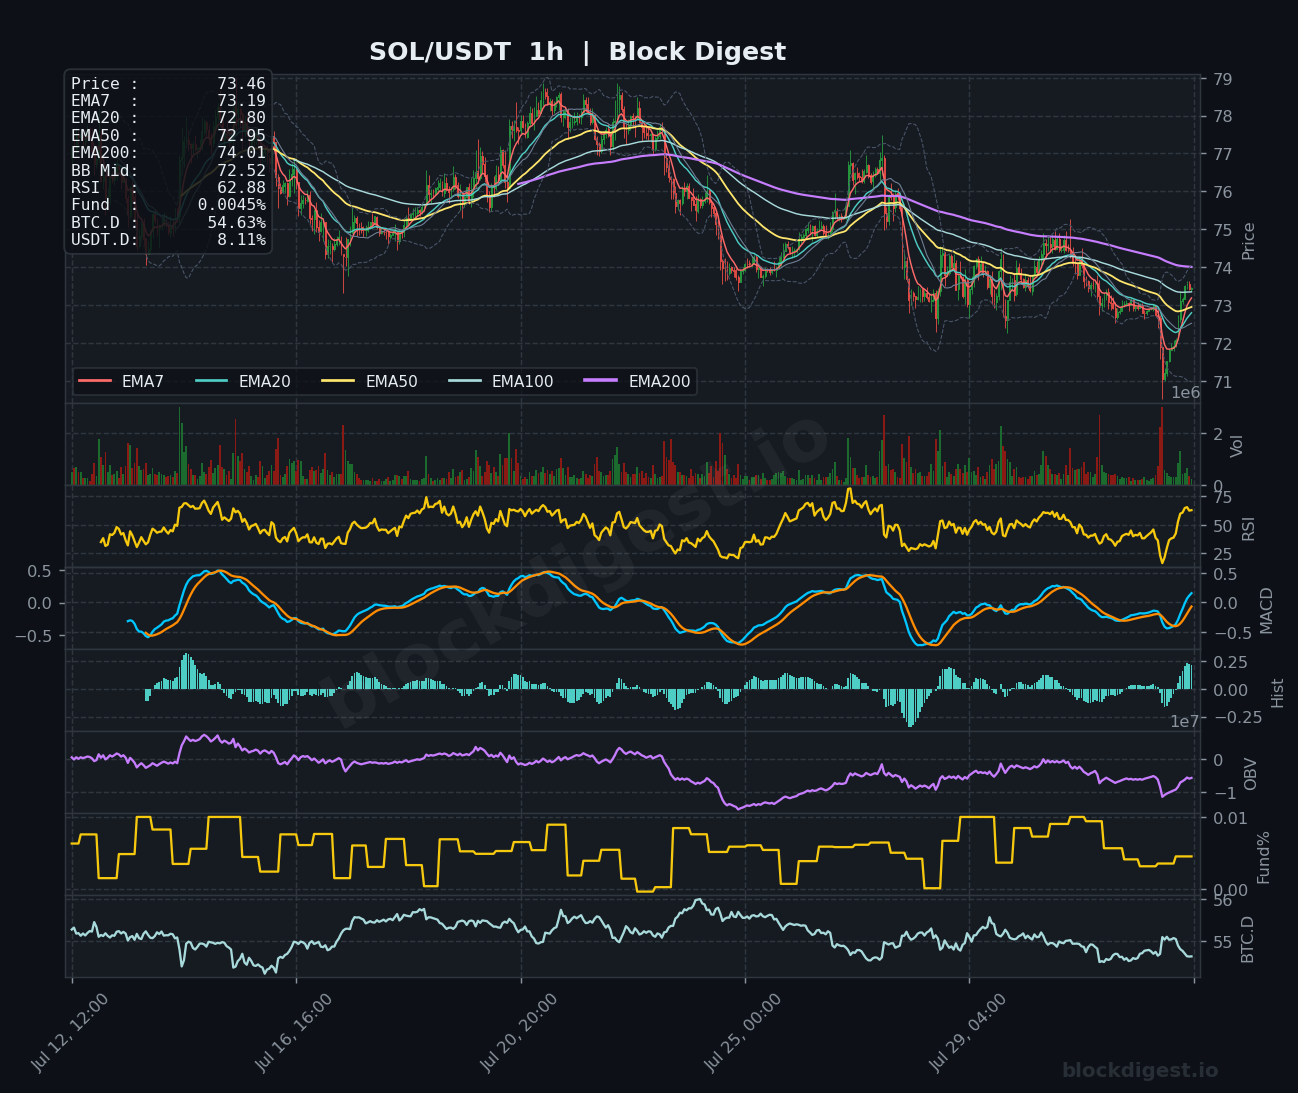
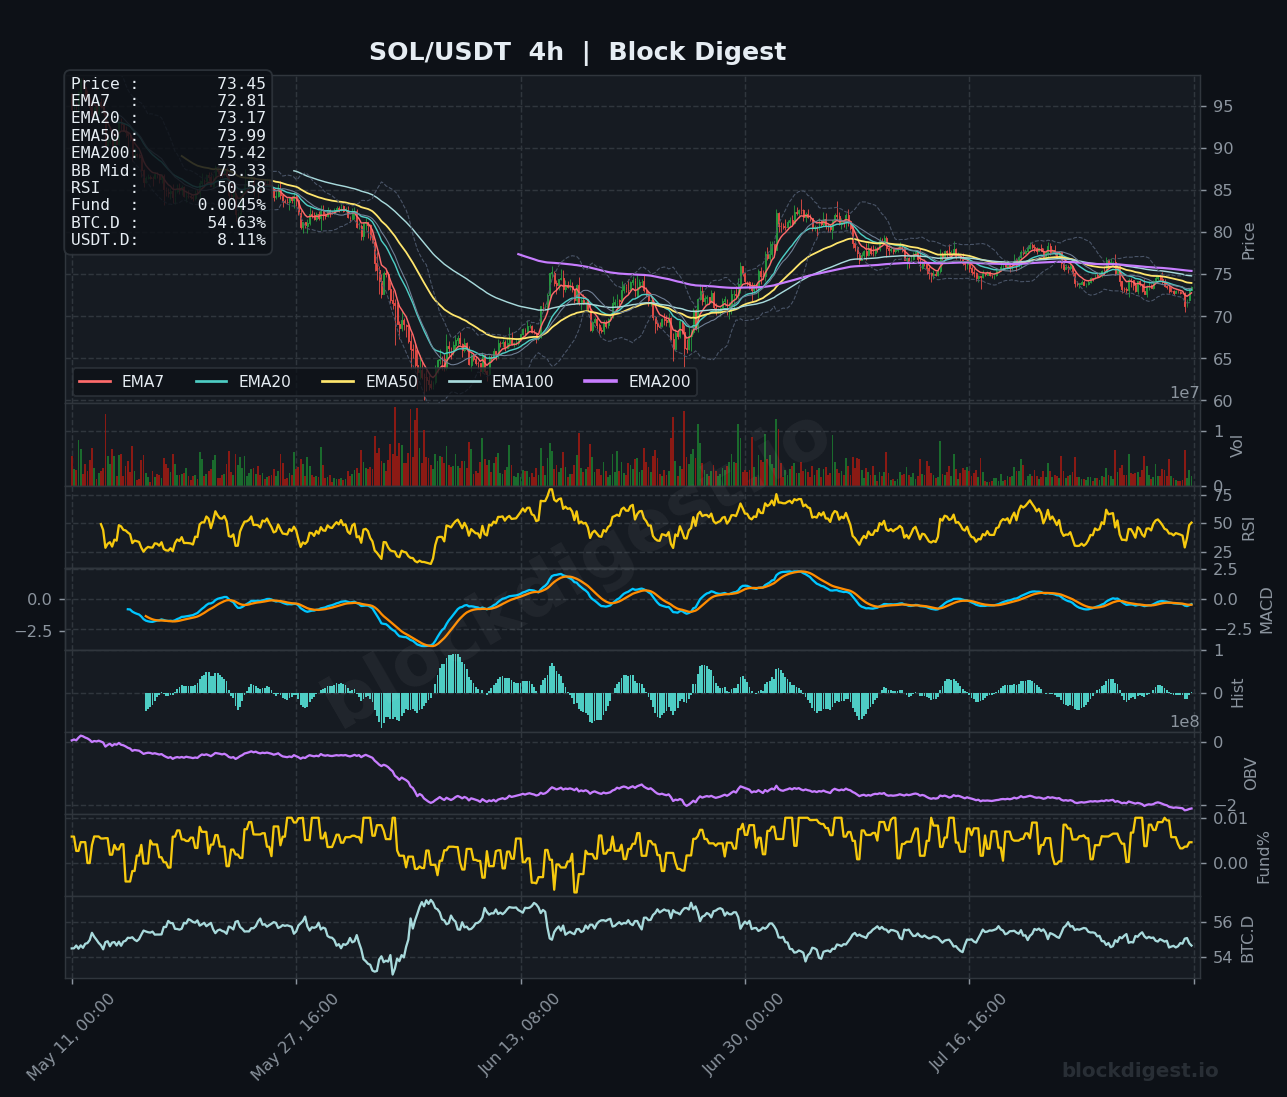
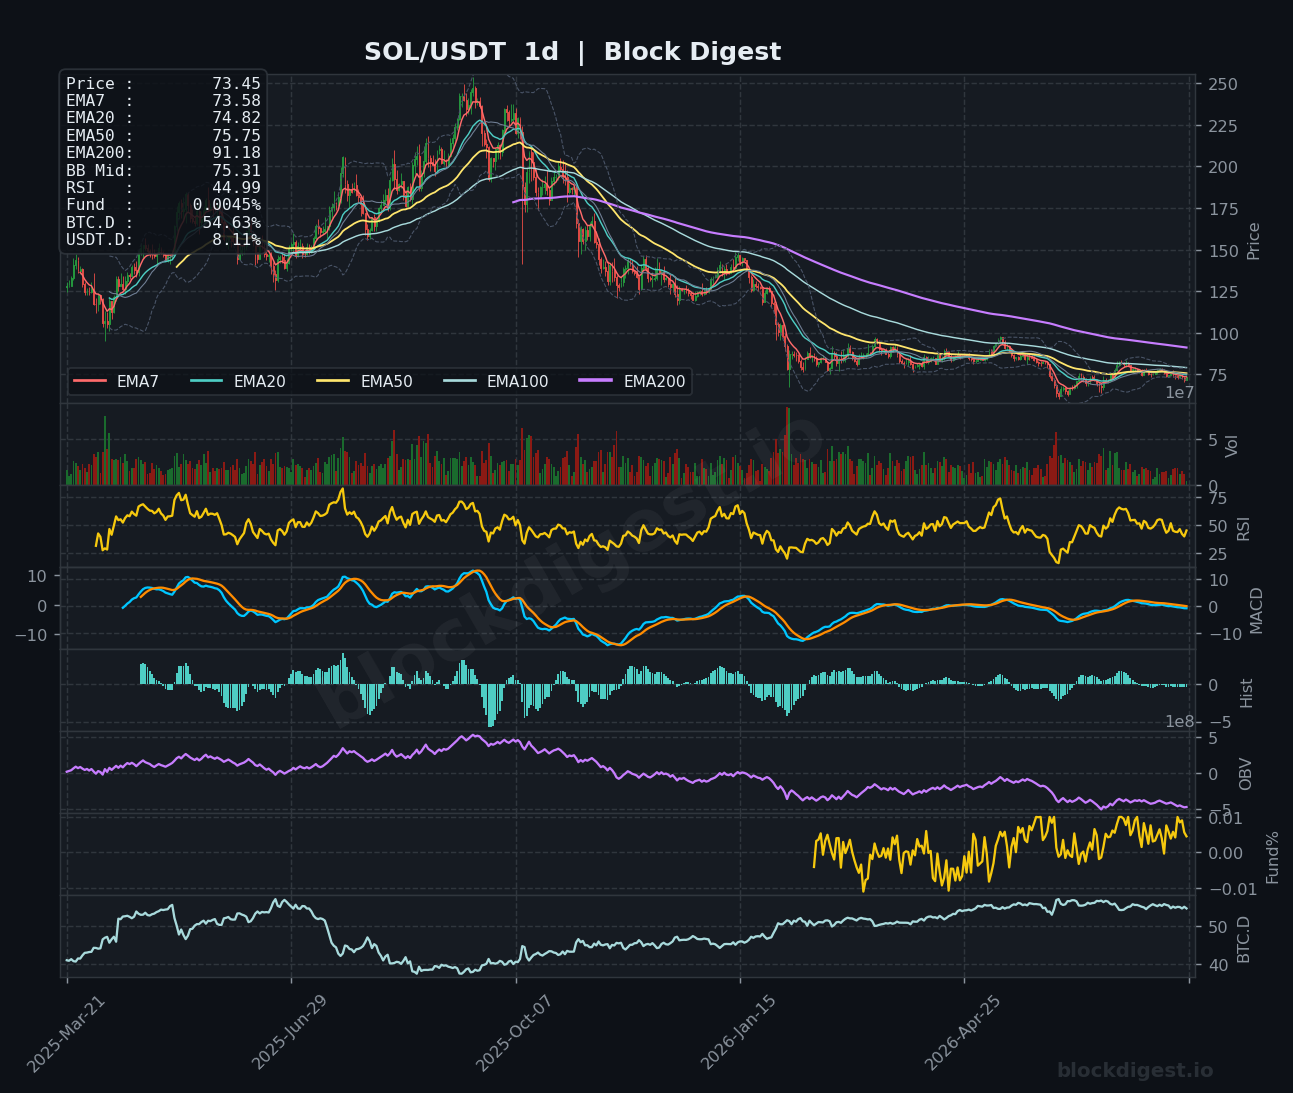
SOL is trading at $73.45, caught in a deteriorating structure across all timeframes. On the 1h chart, price has slipped beneath the EMA200 at $74.01, with the entire short-term EMA stack now fanning bearishly — a clear sign of distribution rather than consolidation. The 4h RSI sits at 50.58, technically neutral but hugging the midline after failing to reclaim higher ground, while the 4h MACD remains compressed near zero with histogram bars shrinking, offering no credible bullish signal. On the daily, price is well below both the EMA50 ($75.75) and EMA200 ($91.18), and the daily RSI of 44.99 suggests SOL is gravitating toward oversold territory without yet finding a structural floor — short-term bias is cautiously bearish, with $71–$72 acting as the immediate support zone to watch.
XRP (XRP)
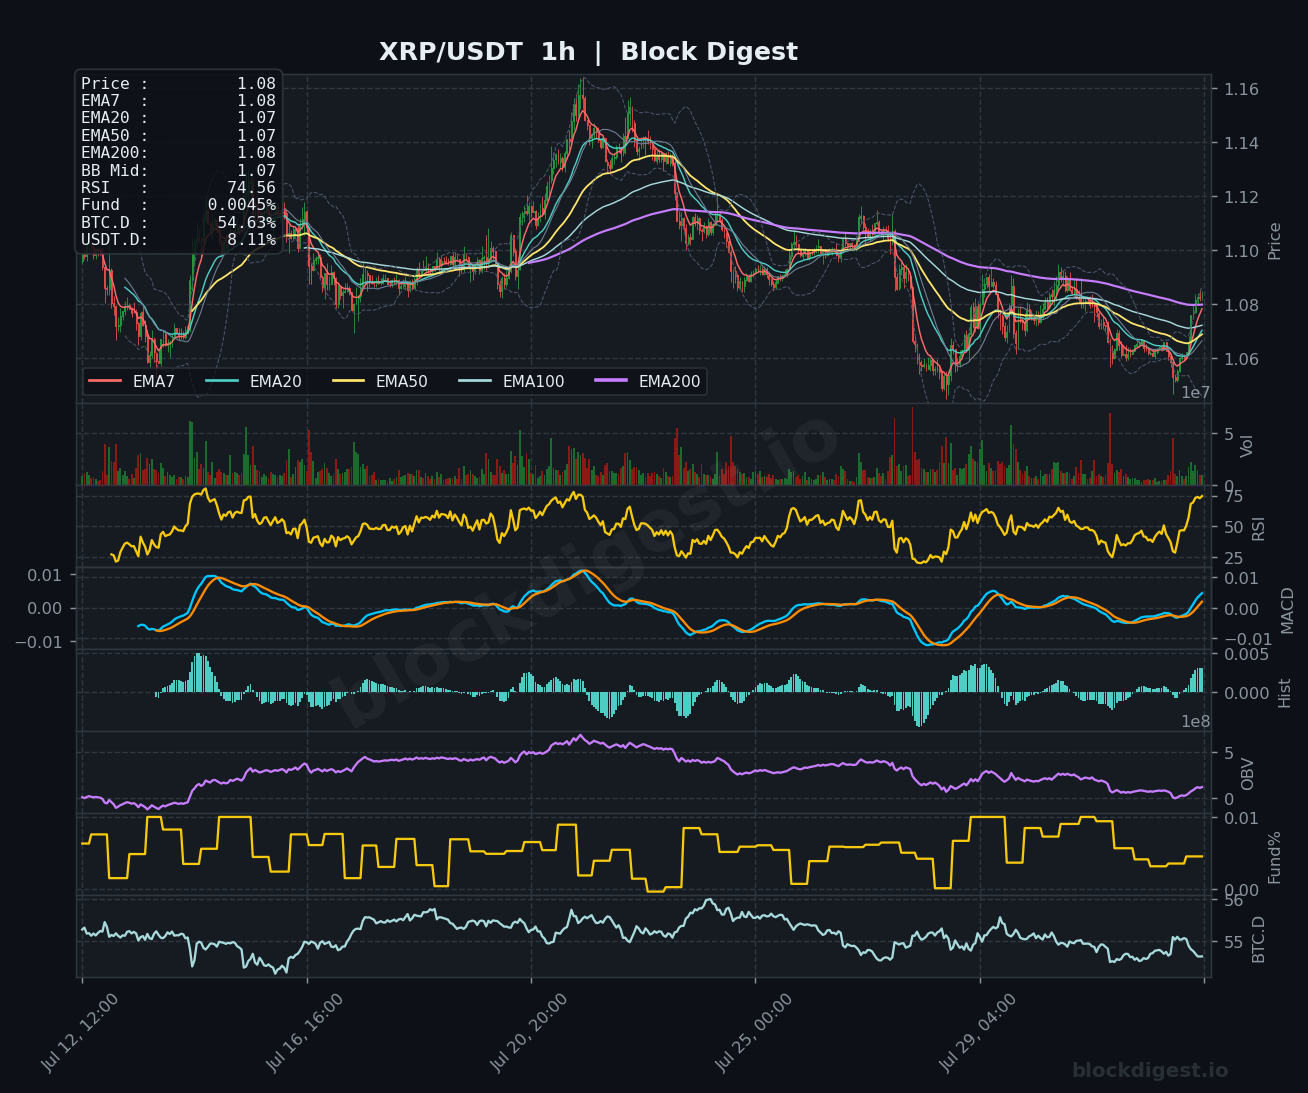
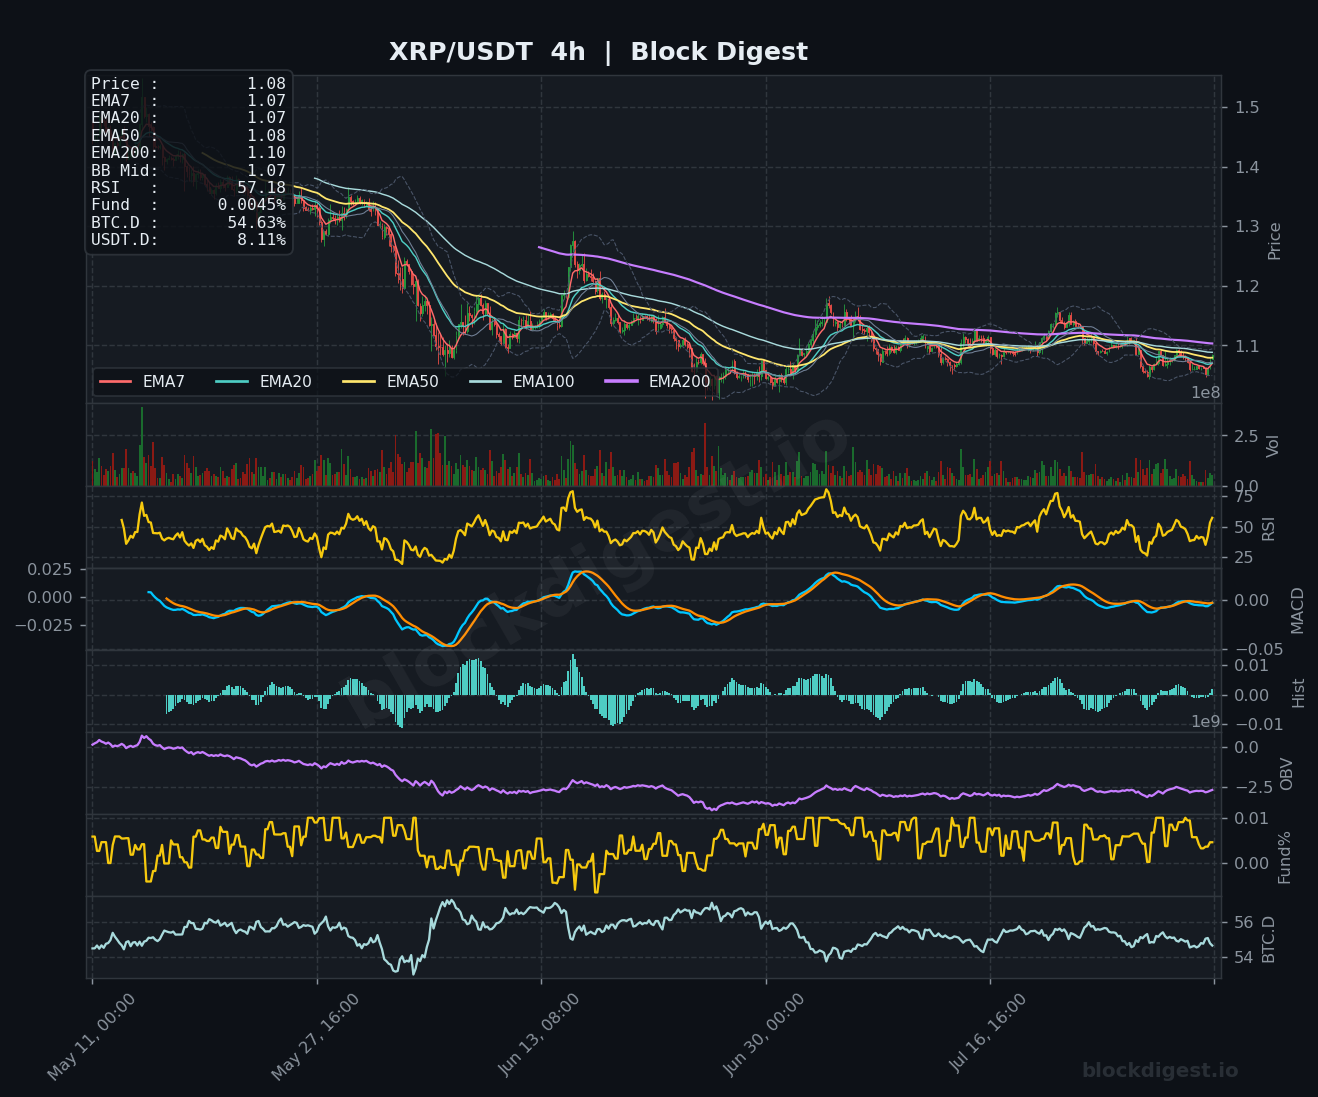
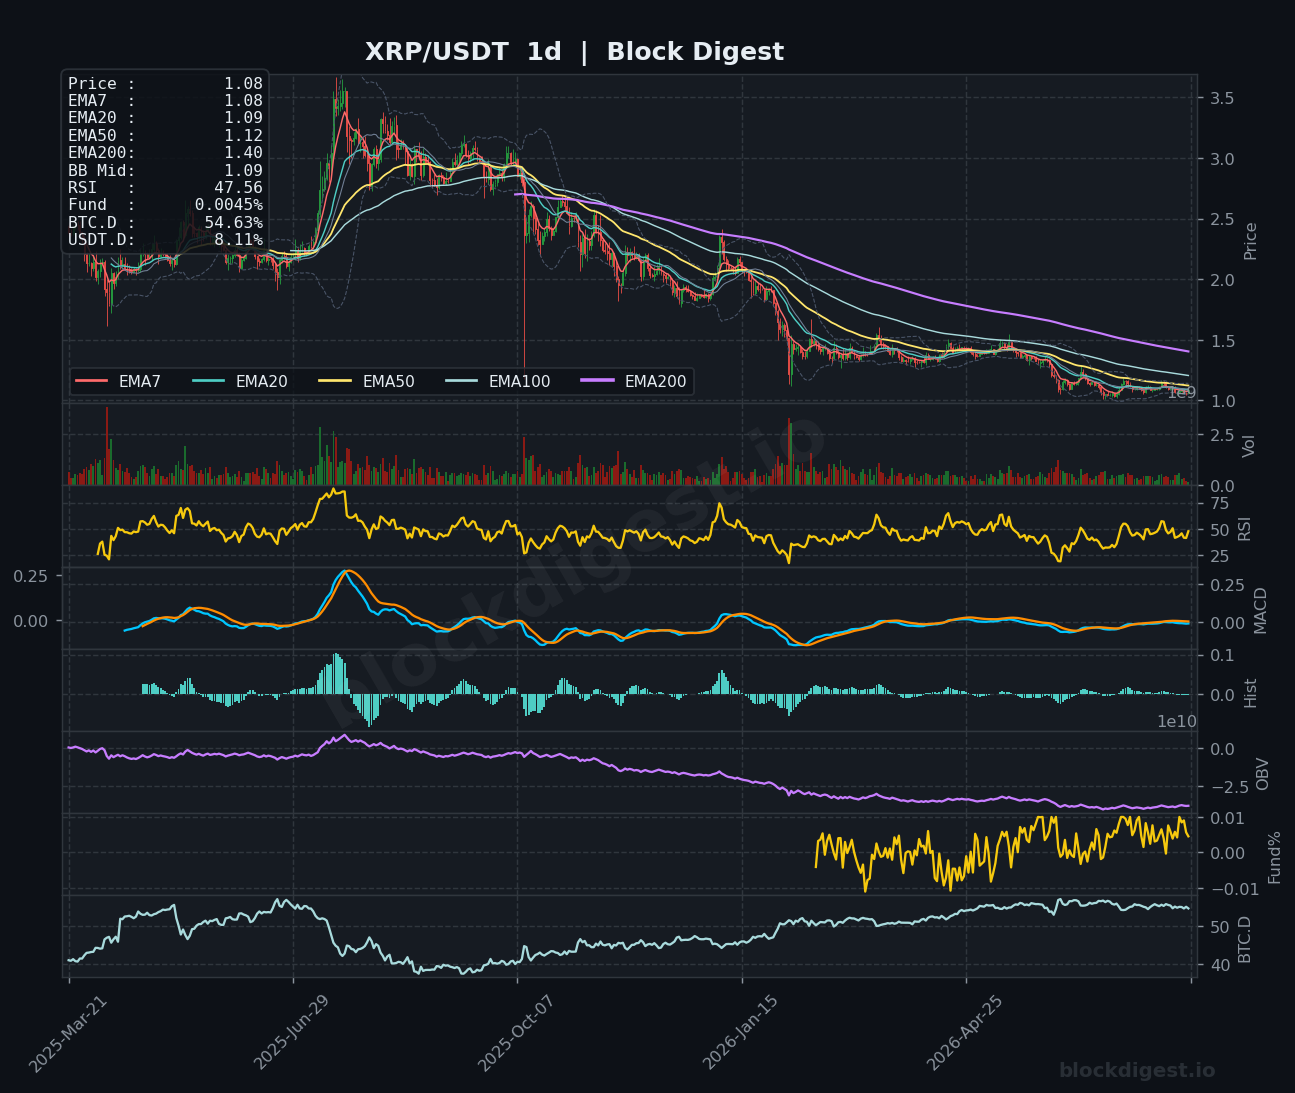
XRP is trading around $1.08, attempting to stabilize after a sharp multi-week decline from the $1.15 area, but the broader technical picture remains challenged. On the 1h chart, the RSI has spiked to 74.56 — notably overbought on the short timeframe — suggesting the recent intraday bounce may be overextended and vulnerable to a mean-reversion pullback toward the $1.06–$1.07 cluster where the EMA50 and EMA20 converge. The 4h structure tells a more cautious story: price is trading just beneath the EMA200 ($1.10) with MACD lines near flat and histogram bars barely positive, reflecting a weak recovery rather than a genuine trend reversal. On the daily chart, RSI at 47.56 and price sitting beneath EMA50 ($1.12) and the strongly declining EMA200 ($1.40) confirm that XRP remains in a macro downtrend, and any near-term bounce should be treated with skepticism unless $1.10 is decisively reclaimed with volume.
BNB (BNB)
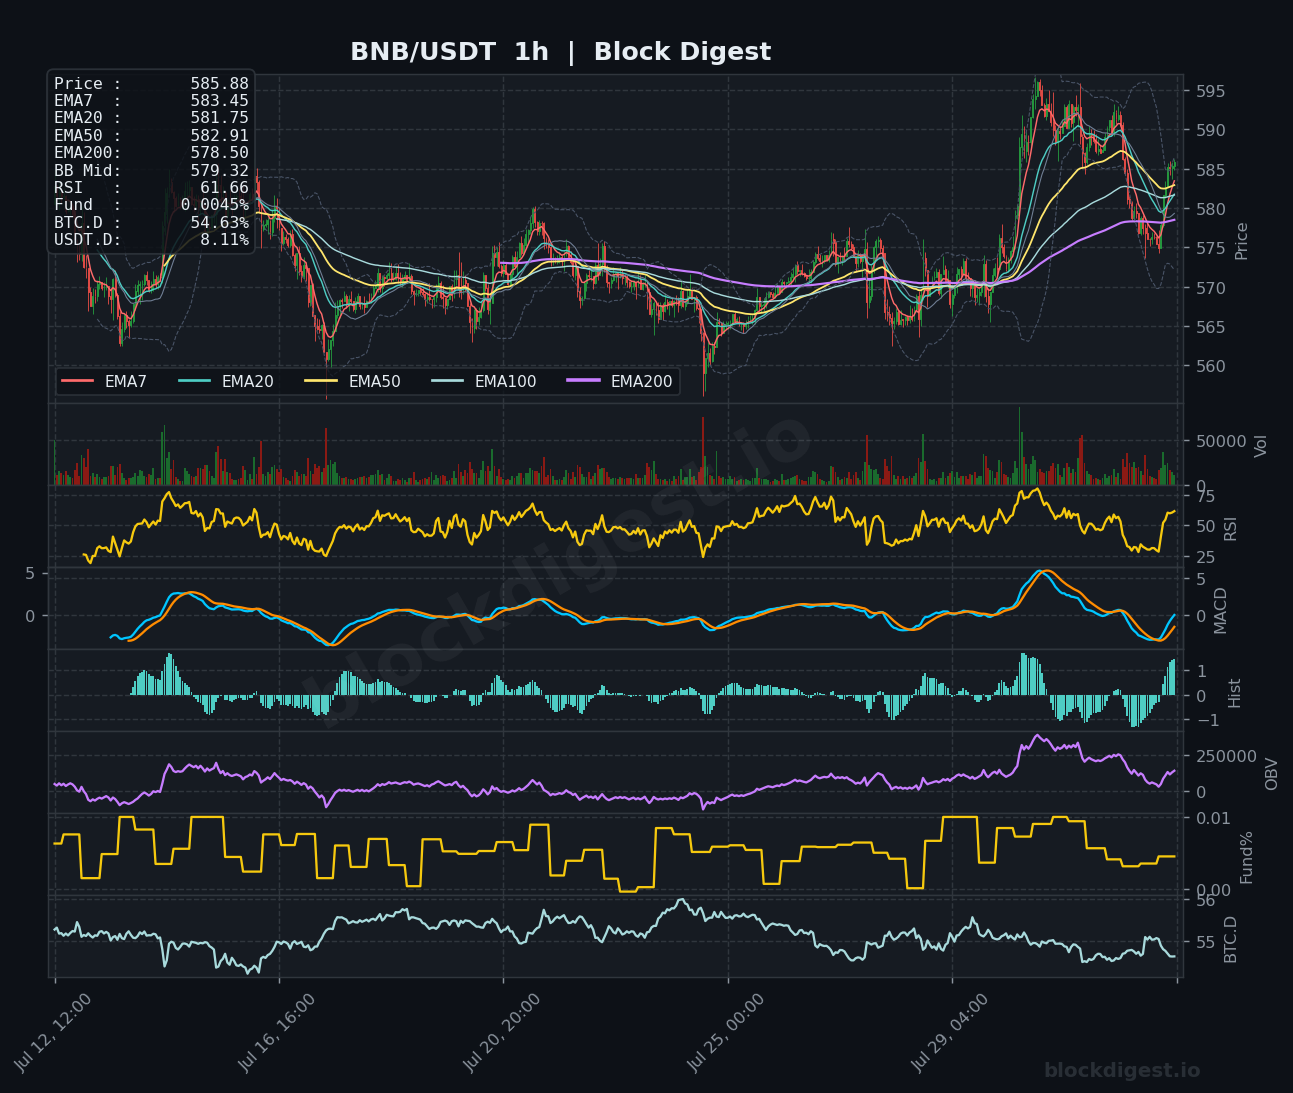
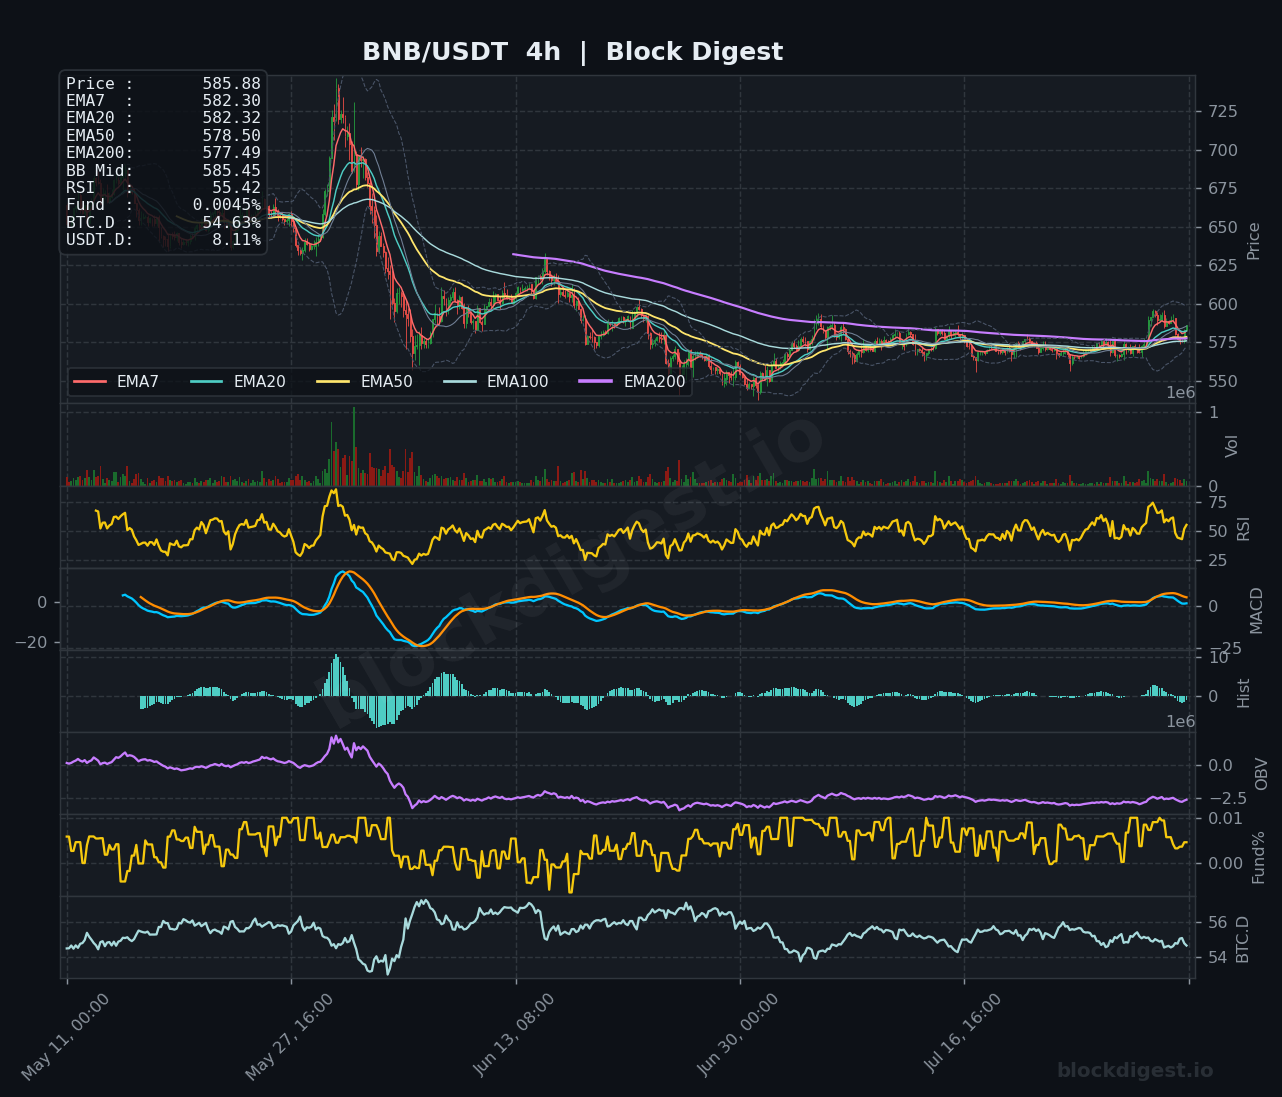
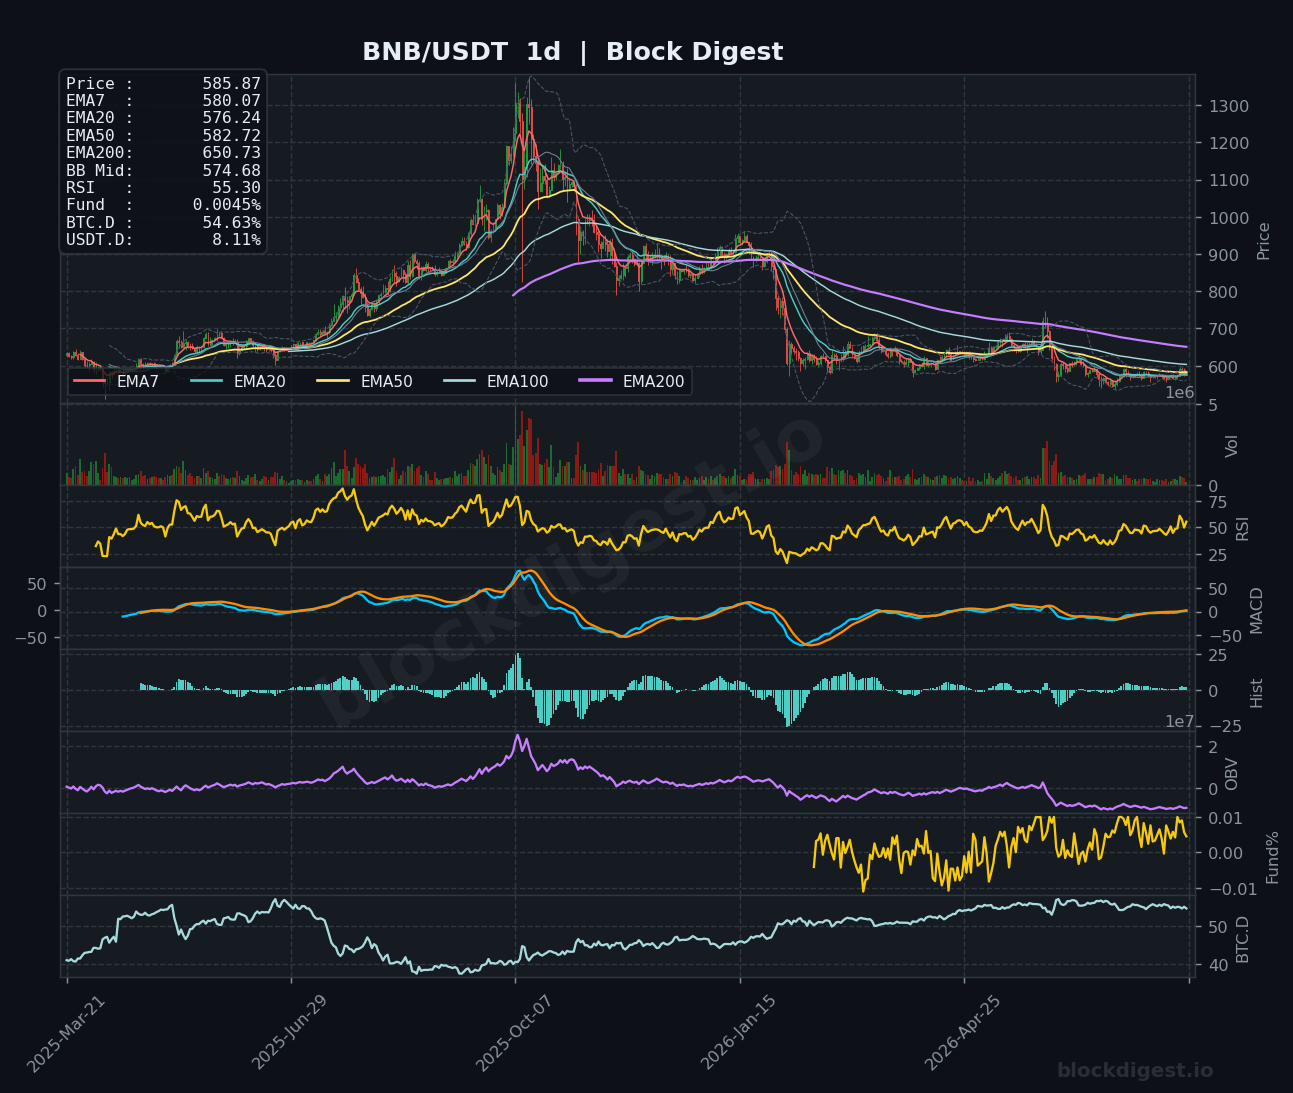
BNB is showing the most constructive short-term setup among the six coins covered today, trading at $585.88 with the 1h EMA stack aligned bullishly — EMA7 ($583.45) through EMA200 ($578.50) all fanning upward beneath price. The 1h RSI at 61.66 has room to extend before reaching overbought territory, and the MACD histogram is printing positive bars after a clean crossover, supporting near-term upside momentum. On the 4h timeframe, RSI is at 55.42 and price is attempting to reclaim the Bollinger Band midline at $585.45, though the EMA200 at $577.49 is acting as a rising support floor — a healthy sign. However, the daily chart remains a structural headwind, with BNB well beneath its EMA200 at $650.73, so while the short-term setup is favorable for a push toward $590–$595, conviction for a sustained recovery requires a daily close above the $600 psychological level.
Dogecoin (DOGE)
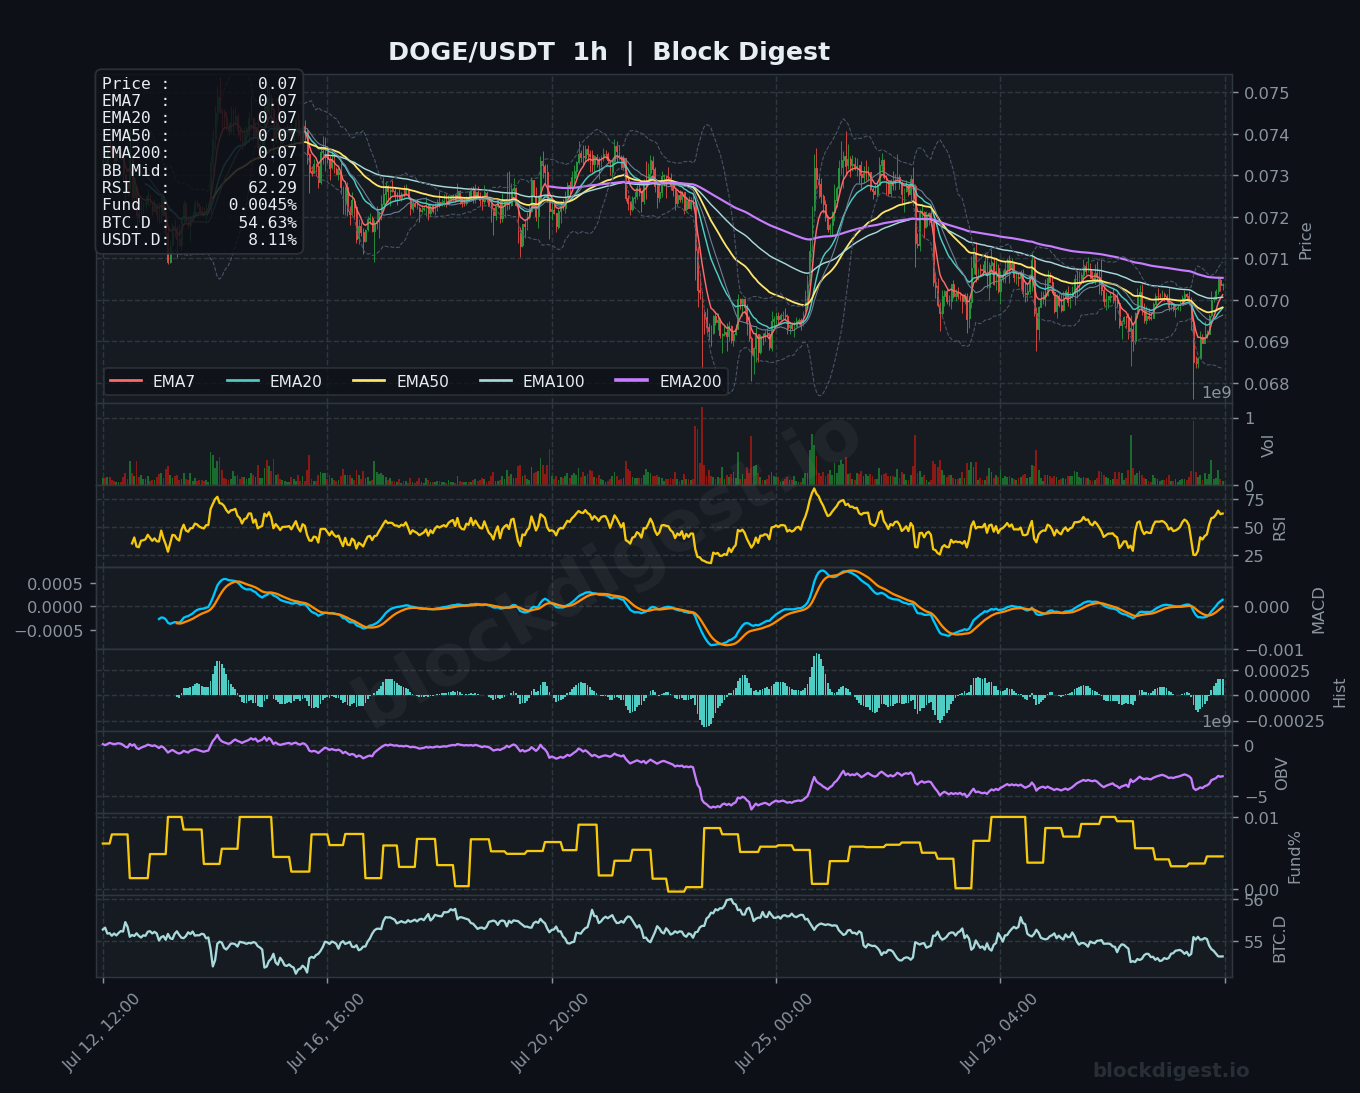
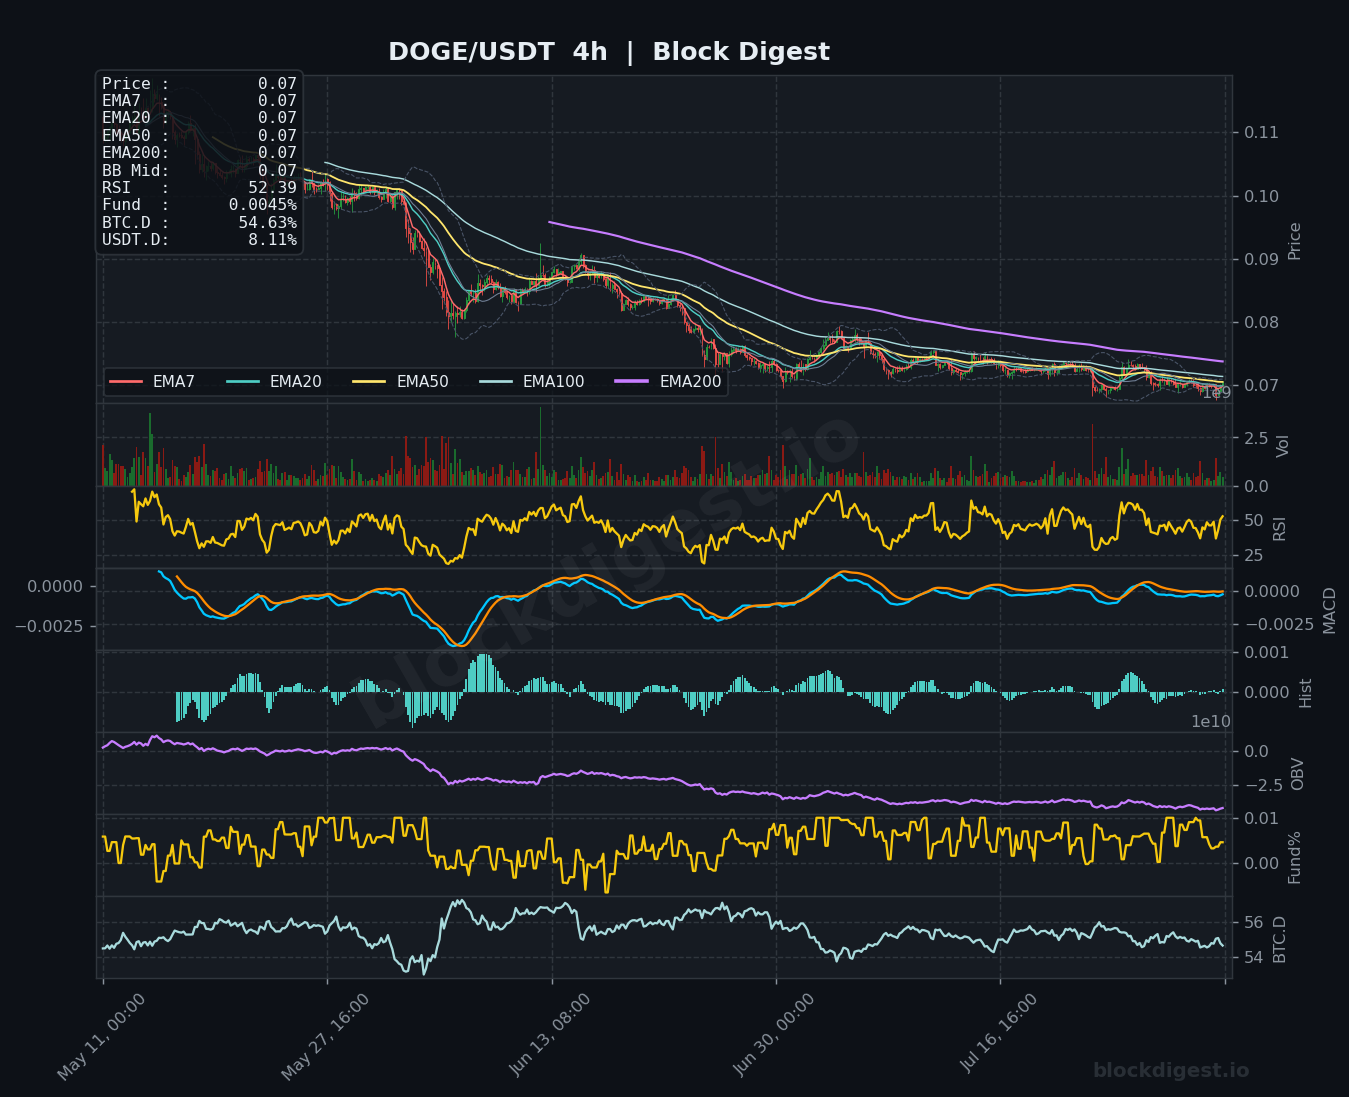
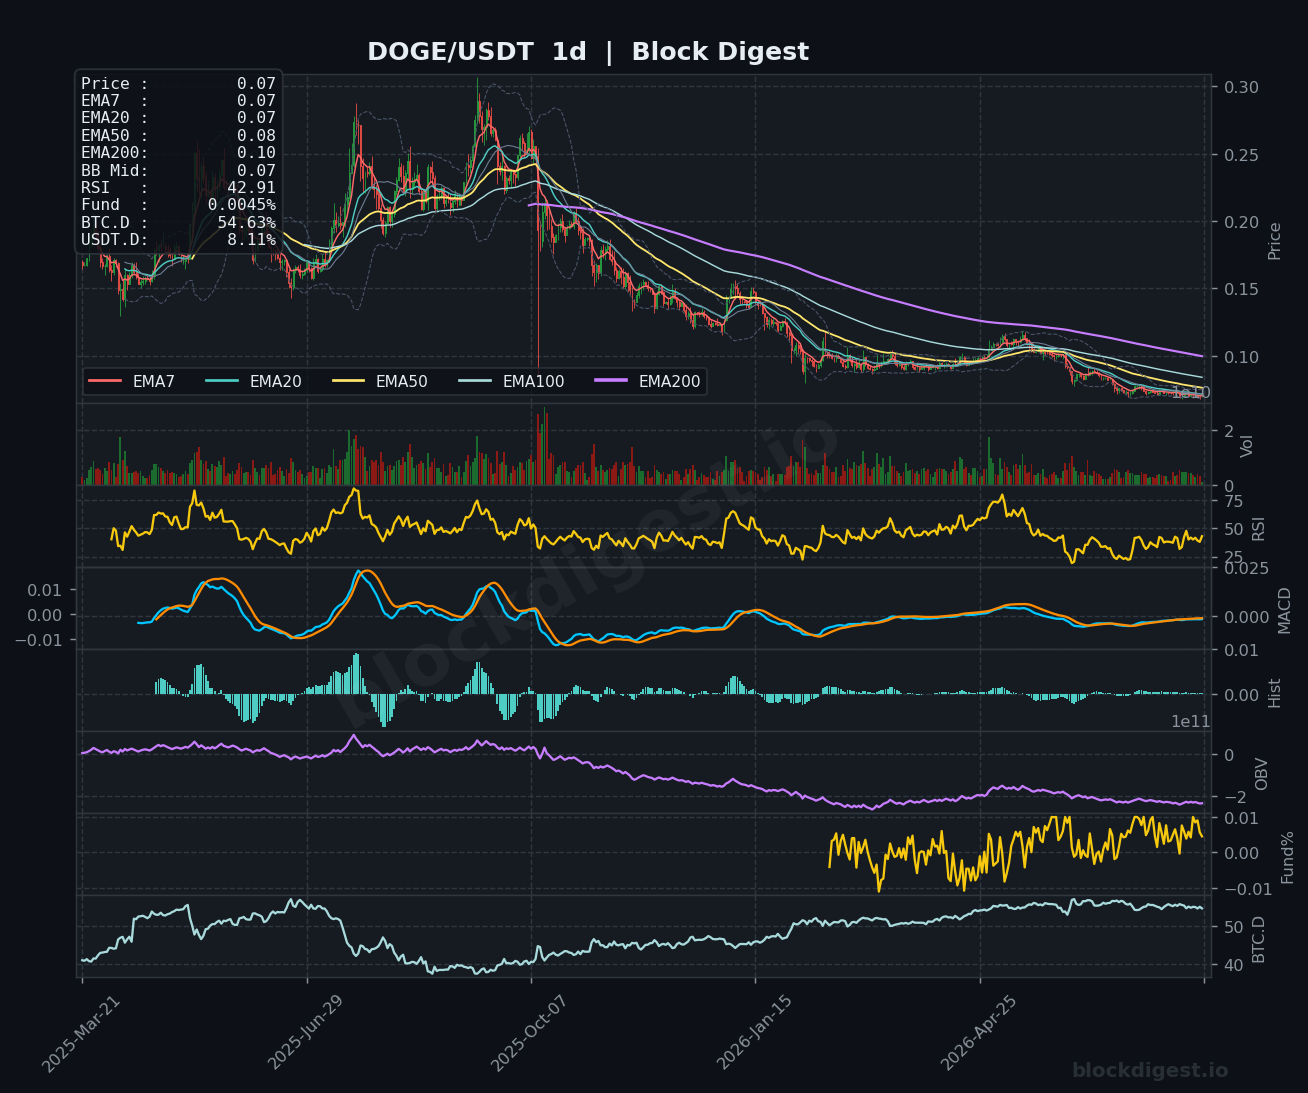
DOGE continues to trade at $0.07, pinned in an extremely tight range that belies the distribution visible across higher timeframes. On the 1h chart, all EMAs are stacked flat at $0.07 with no meaningful separation, and while the RSI at 62.29 shows a minor short-term uptick, the MACD histogram is barely positive — this is not a coin building momentum. The 4h chart is more revealing: RSI at 52.39 is neutral, and the declining EMA200 overhead at $0.07 acts as a ceiling rather than support, keeping DOGE capped in a compressing range. Most damning is the daily view — RSI at 42.91 is drifting toward the bearish zone, the EMA50 ($0.08) and EMA200 ($0.10) are both well above price and trending lower, and the OBV remains in a persistent downtrend, confirming that buyers are not stepping in with conviction at current levels. Bias remains bearish, with $0.068 as the key support level to watch.
Litecoin (LTC)
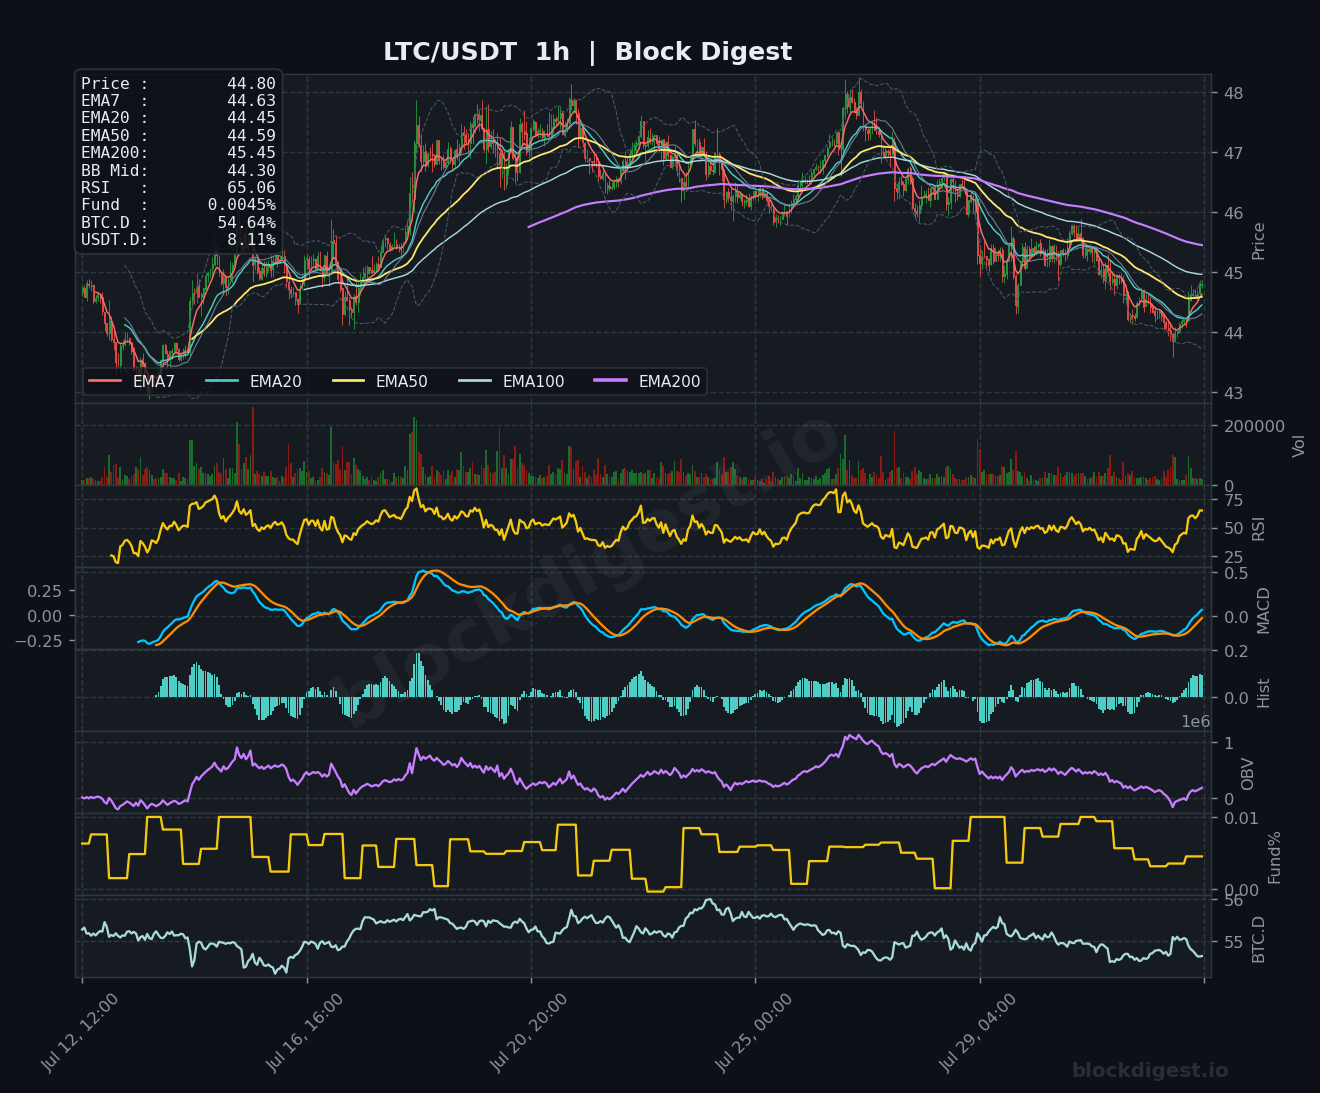
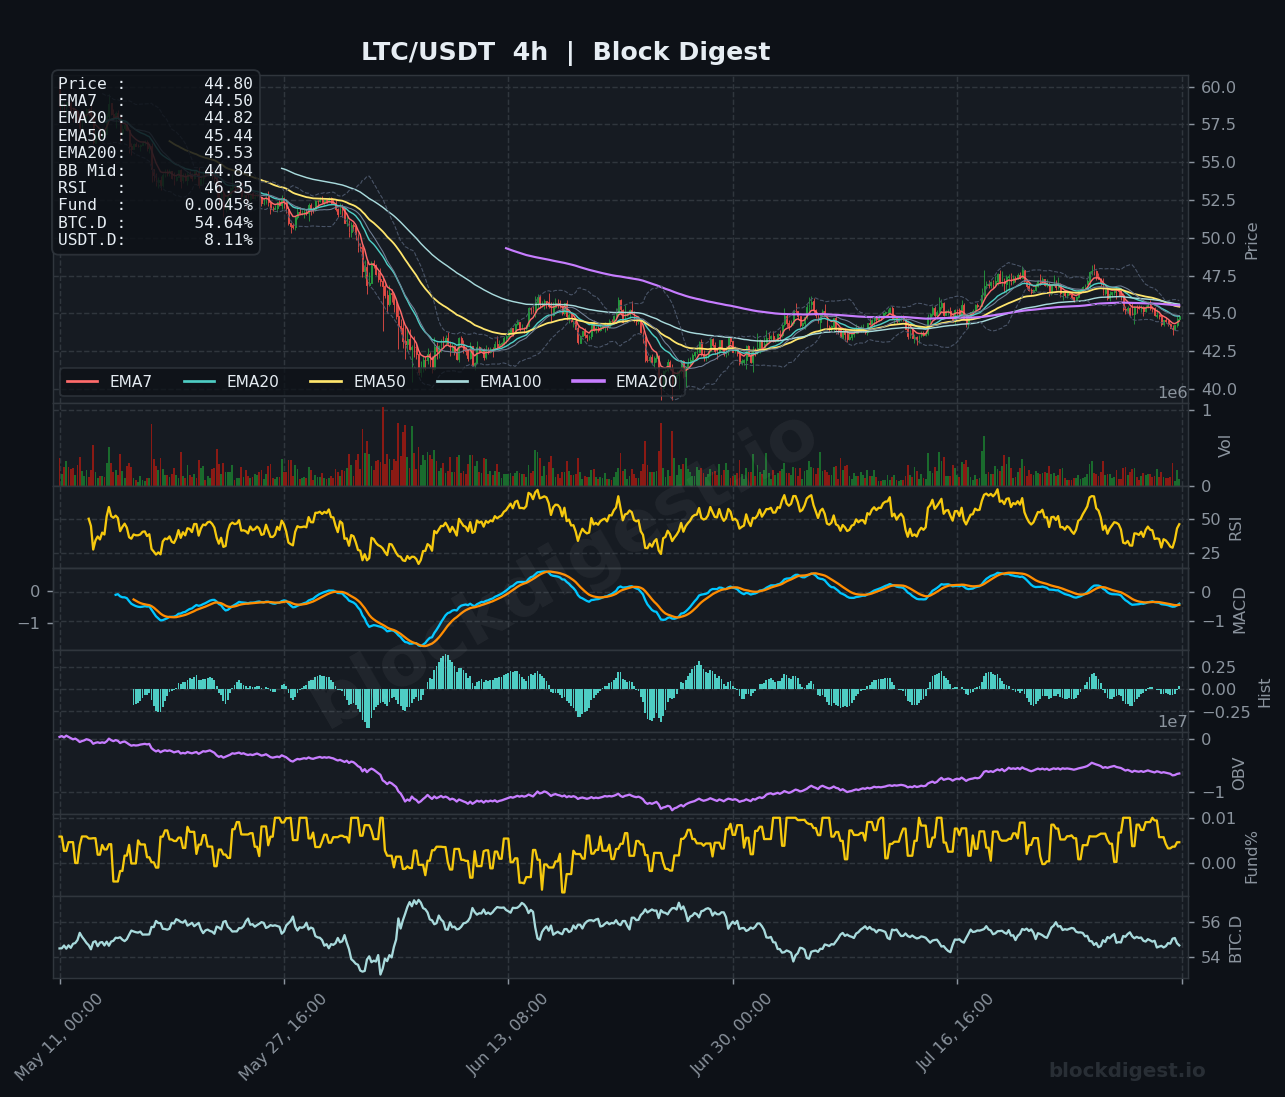
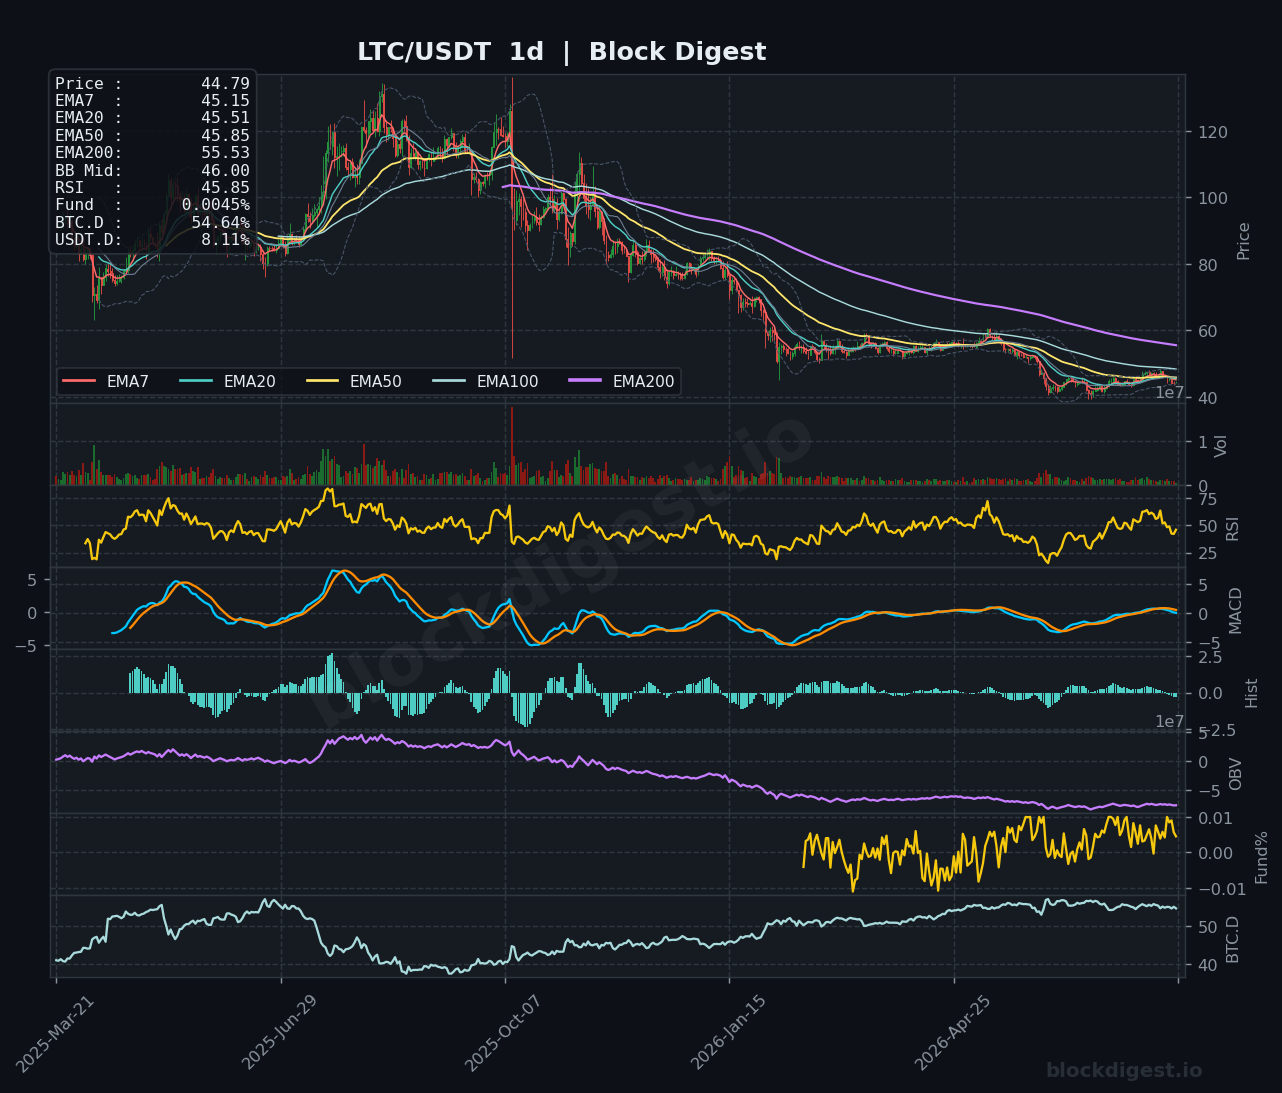
LTC is trading at $44.80, in a mildly interesting short-term position after a sharp recent pullback from the $48 area. The 1h chart shows an RSI of 65.06 — elevated but not yet overextended — with price recovering back above the EMA7 ($44.63) and EMA20 ($44.45), suggesting a tentative bounce attempt is underway. However, the 4h RSI at 46.35 and a MACD that is still marginally negative on that timeframe indicate the medium-term trend has not yet turned — price is essentially consolidating beneath a cluster of descending EMAs between $44.82 and $45.53. The daily chart reinforces caution: RSI at 45.85 is sub-50 and declining, the EMA200 at $55.53 sits far overhead, and OBV on the daily has been in a persistent downtrend for months. A reclaim of the $45.50–$46.00 zone on a 4h closing basis would be the minimum requirement to shift the short-term bias to neutral.
TRON (TRX)
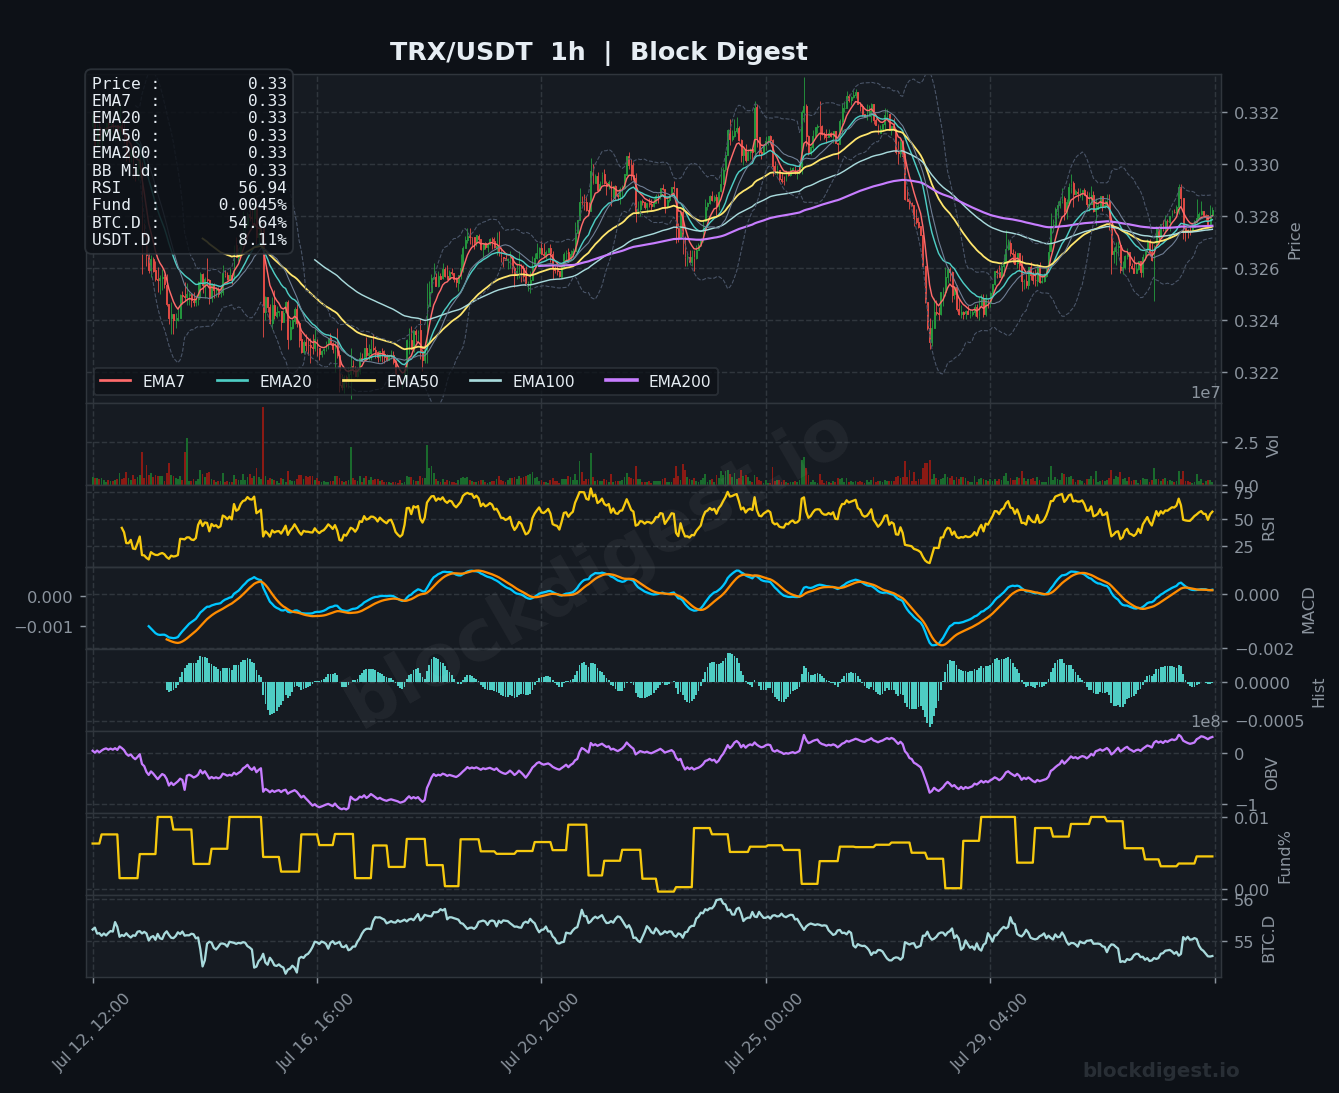
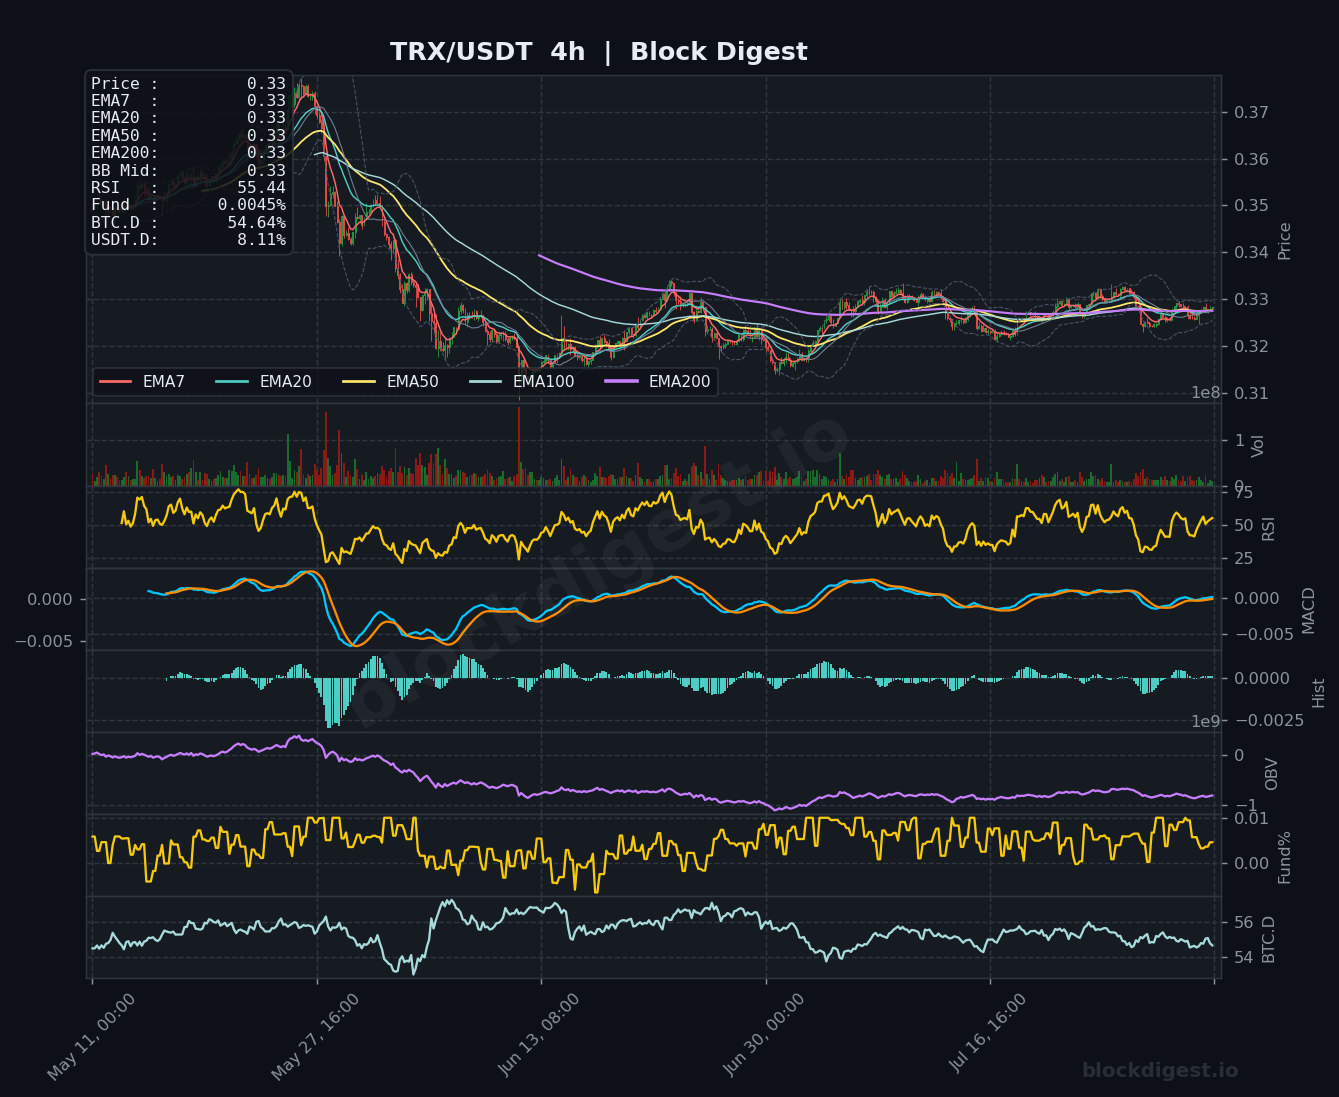
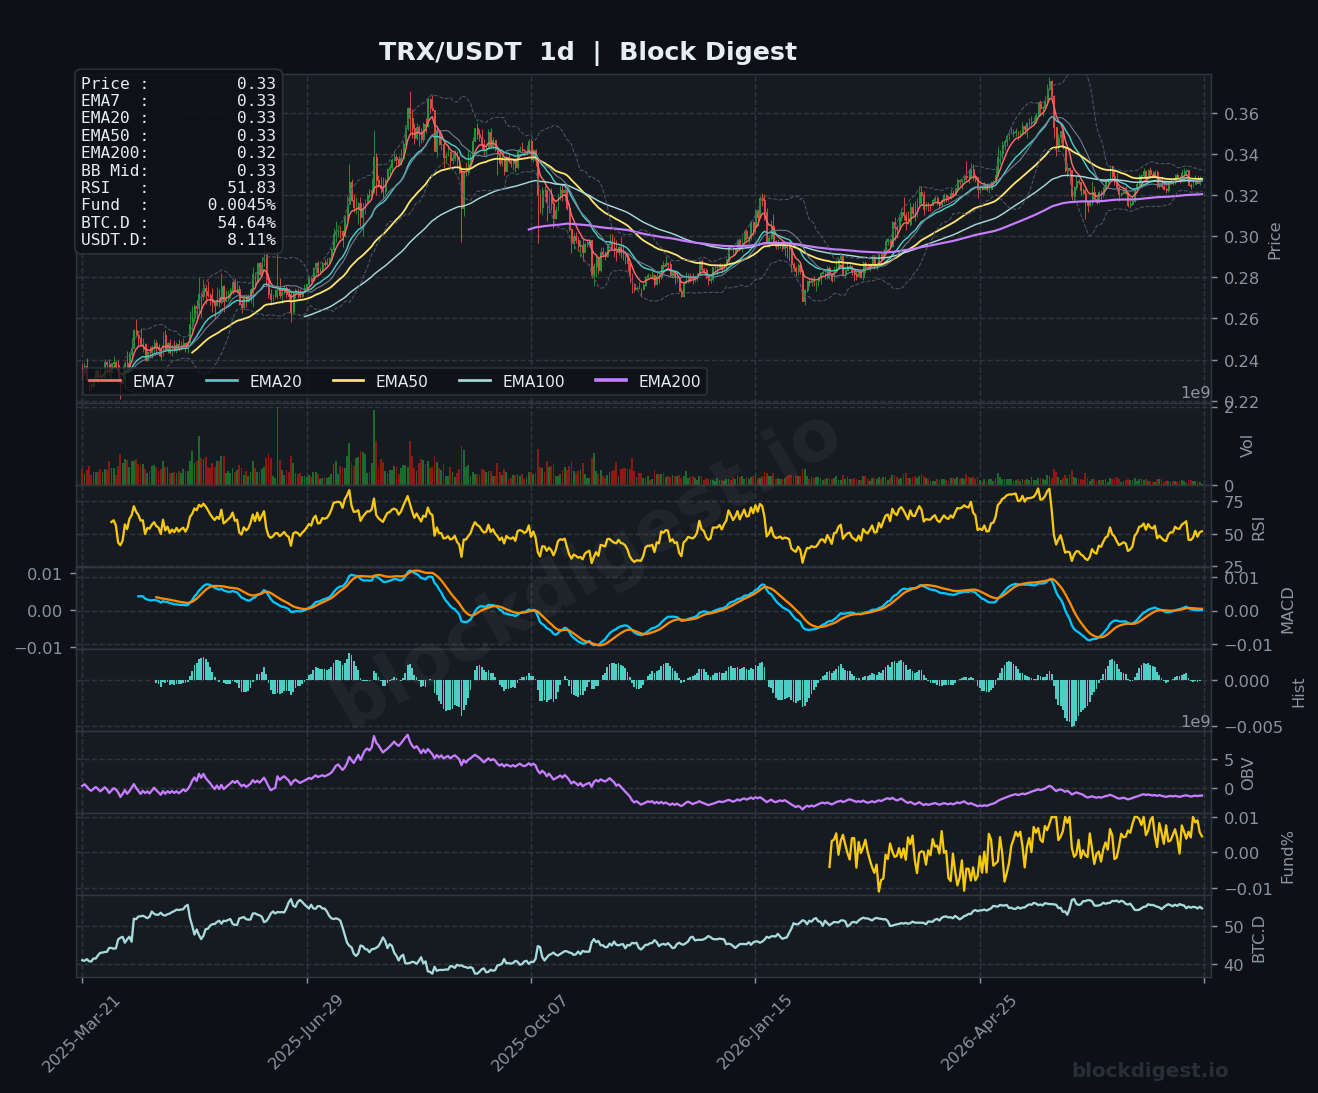
TRX at $0.33 remains one of the more structurally stable assets in today’s coverage, though its upside looks limited in the current environment. On the 1h chart, price is hovering around the EMA cluster with an RSI of 56.94 and a MACD that is attempting a mild recovery cross above zero — mildly constructive for the very near term. The 4h RSI at 55.44 and price sitting right at the Bollinger midline ($0.33) with EMAs fully compressed in a tight range point to a coin in genuine consolidation rather than a directional trend. Notably, the daily chart shows TRX’s EMA200 at $0.32 — one of the few coins in this group where price is actually trading above its 200-day EMA, offering a modicum of structural support. Daily RSI at 51.83 is neutral, and while the daily MACD histogram has recently turned slightly negative, the broader picture for TRX is range-bound consolidation between $0.32 and $0.335, making it relatively defensive compared to peers.
Altcoin Outlook
The overall altcoin landscape on August 2 is one of fragile consolidation rather than recovery — most assets in this coverage remain in macro downtrends on the daily timeframe, with BTC dominance at 54.64% continuing to act as a structural governor on altcoin capital flows. BNB stands out as the strongest short-term setup, while TRX offers the most defensible macro structure given its position relative to the daily EMA200. SOL, DOGE, and LTC present the weakest setups, each trapped beneath declining long-term moving averages with diminishing OBV trends that suggest distribution rather than accumulation. The key conditions to watch across the space are a sustained drop in BTC dominance below 54% and USDT.D beginning to roll over — until both confirm, dip-buying in altcoins carries meaningful continuation risk to the downside.
—
Disclaimer: This analysis is for informational purposes only and does not constitute financial advice. Cryptocurrency markets are highly volatile and unpredictable. All trading decisions should be made based on your own research and risk tolerance. Block Digest is not responsible for any financial losses incurred as a result of acting on this content.
Stay Ahead of the Market
Follow BlockDigest for crypto market intelligence, research and real-time updates.