Altcoin Daily Analysis — April 27, 2026
# Altcoin Daily Roundup – April 27, 2026
## Market Context
The altcoin market is displaying mixed signals as we close out April, with Bitcoin dominance holding at 54.05% while USDT dominance sits at approximately 6.98%, suggesting moderate risk-on sentiment across crypto markets. Most major altcoins are consolidating near key technical levels, with momentum indicators showing divergence between shorter and longer timeframes. The overall market structure suggests a period of indecision, with traders awaiting clearer directional catalysts before committing to larger positions.
## Solana (SOL)
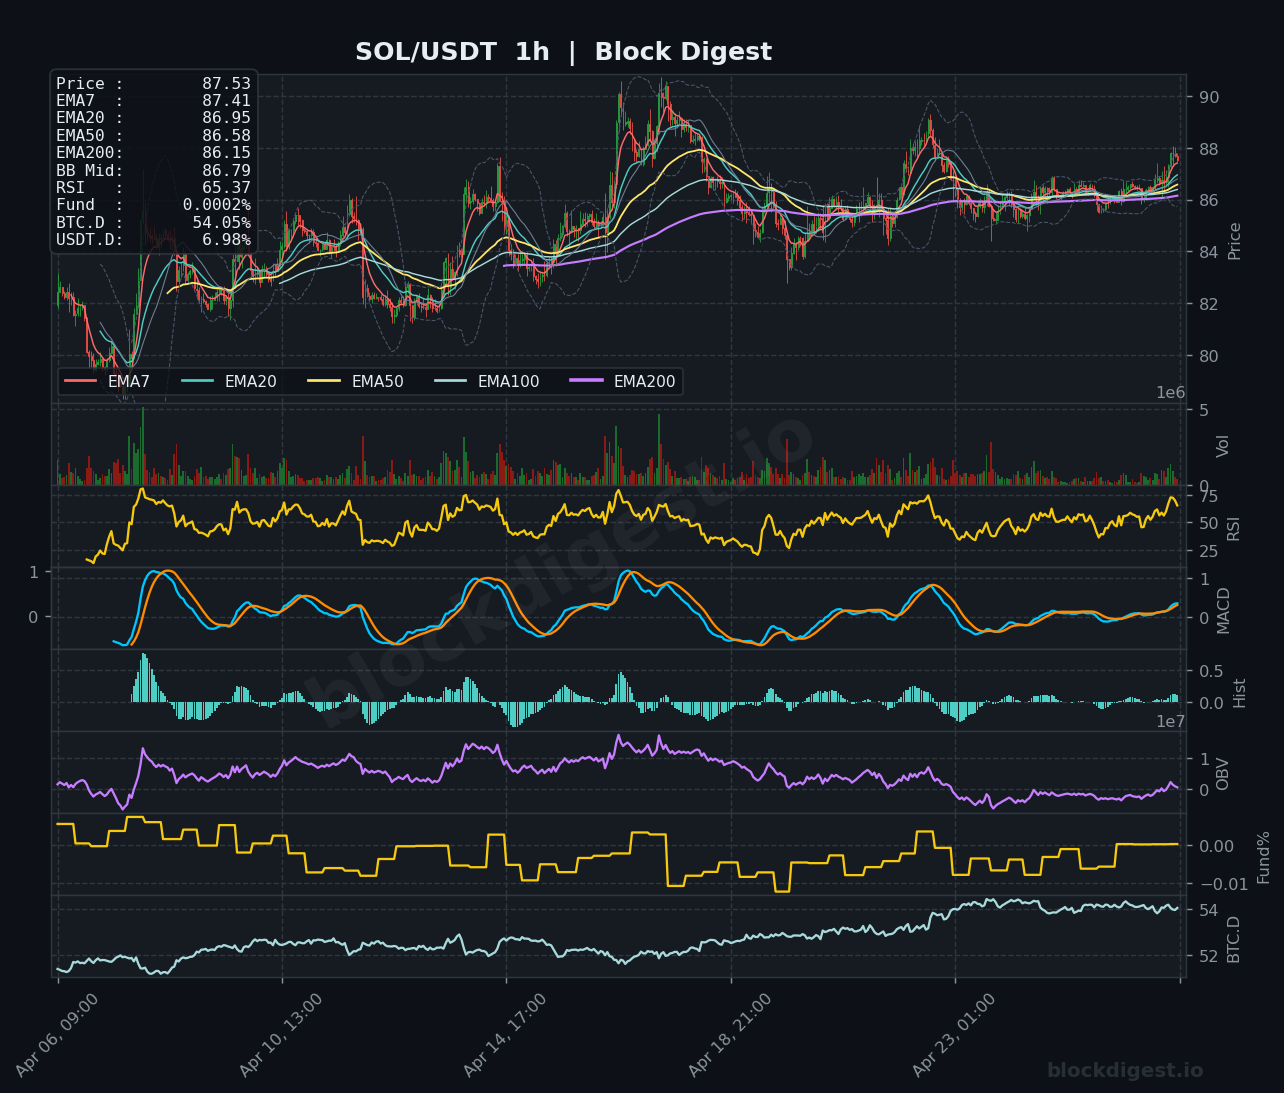
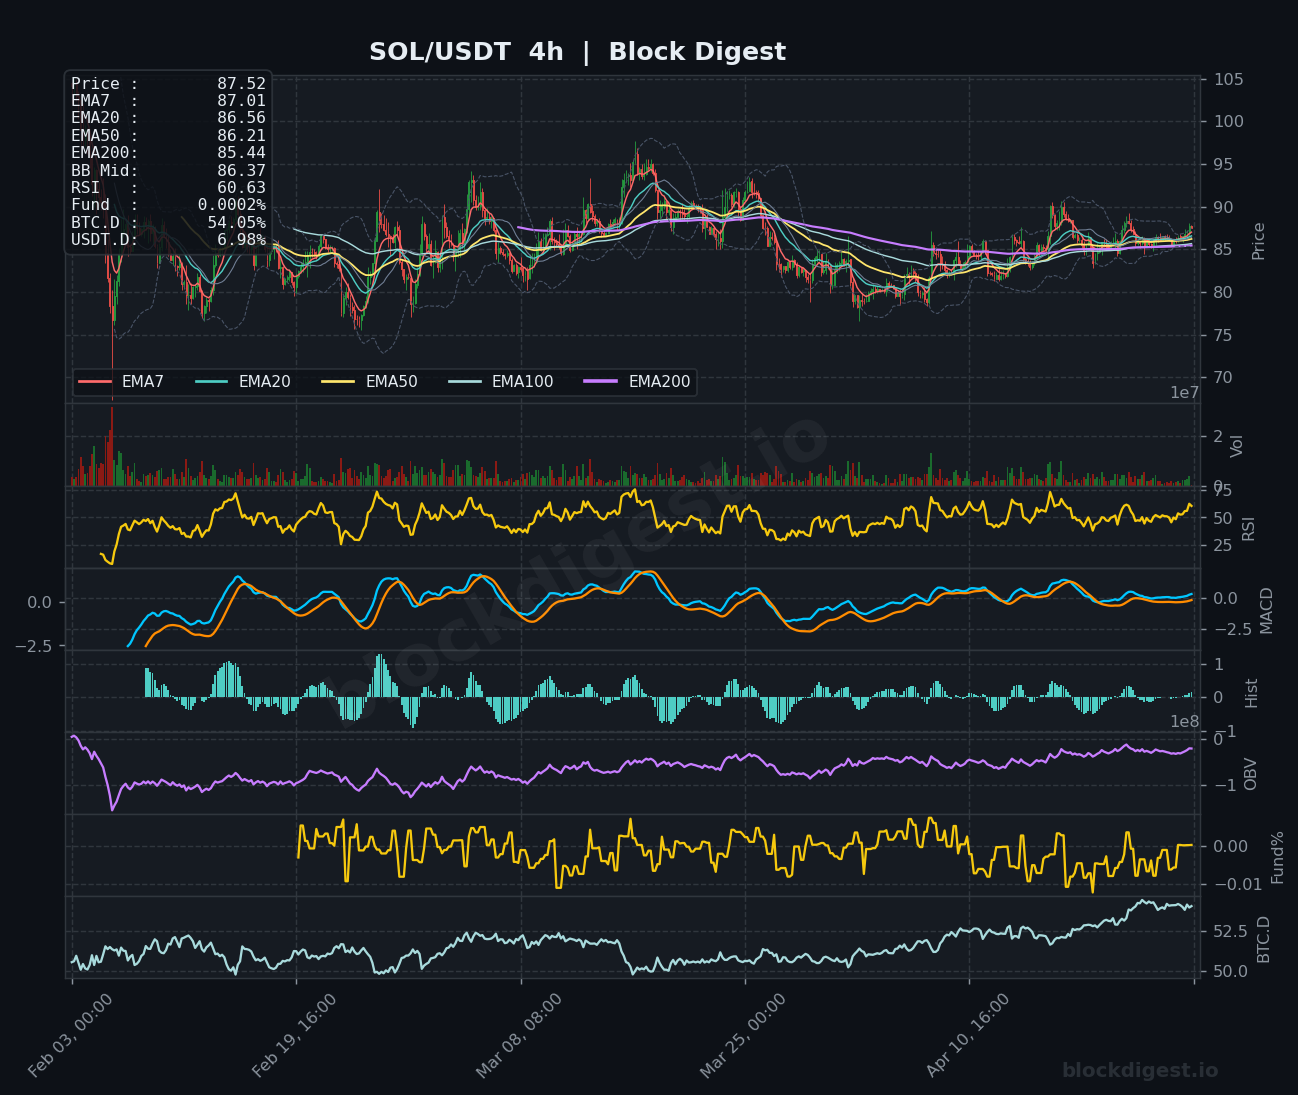
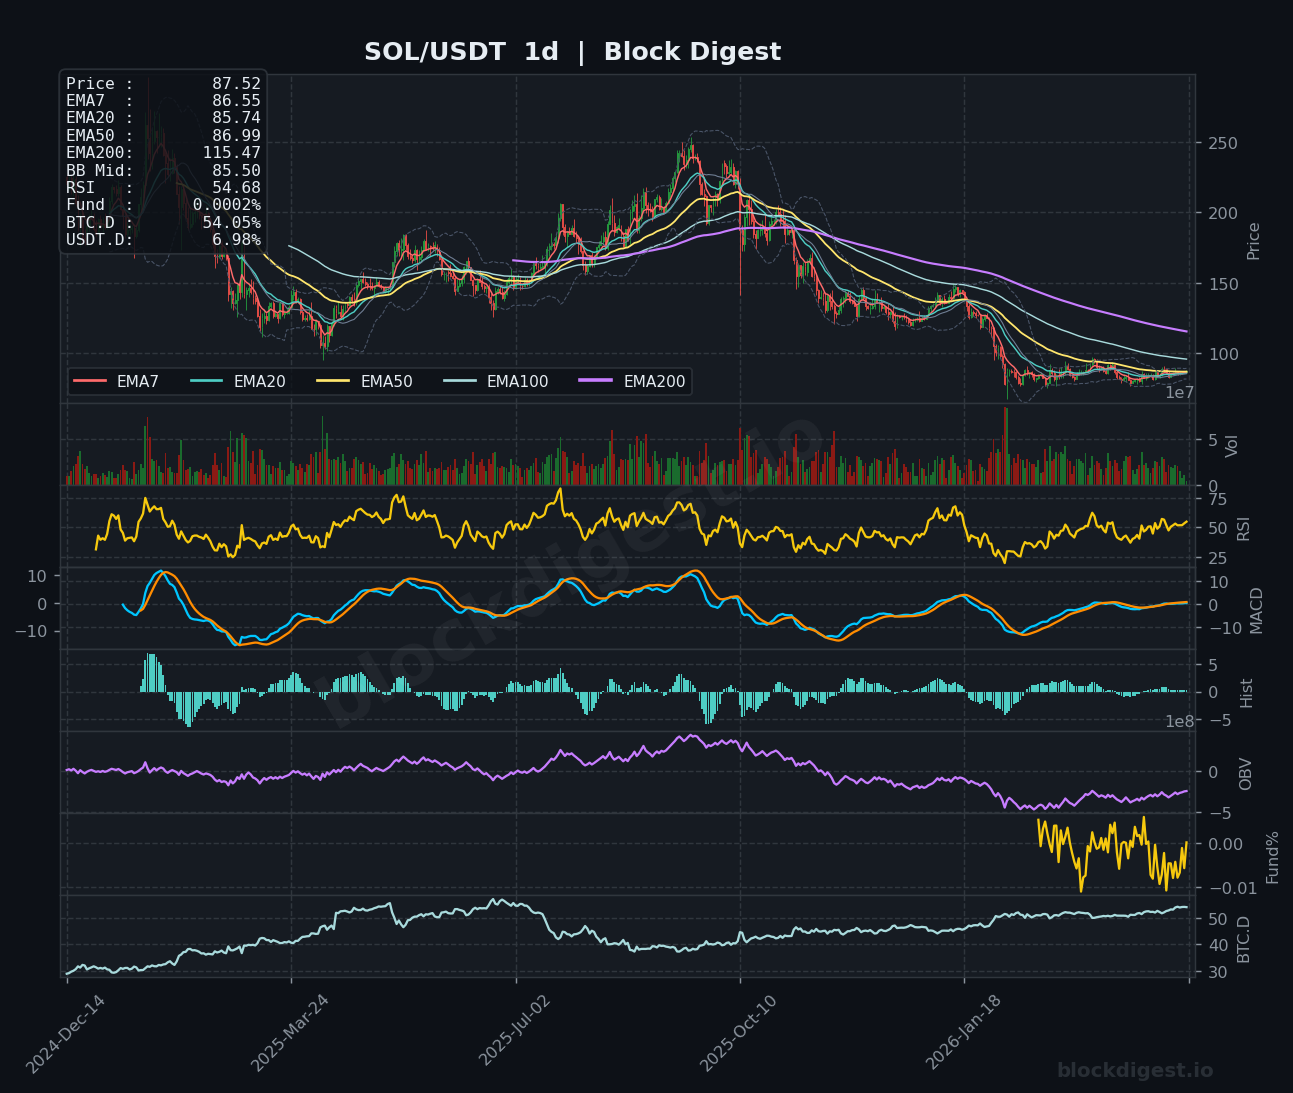
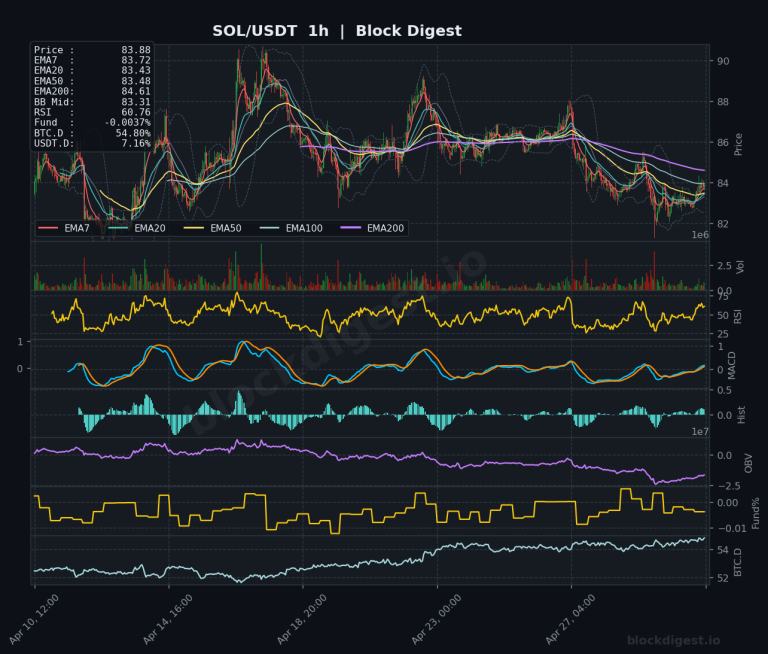
Solana is trading at $87.53, hovering just above its short-term moving averages with the price compressed between the EMA7 at $87.41 and EMA20 at $86.95. The RSI at 65.37 indicates moderately bullish momentum without entering overbought territory, while the MACD shows a slight positive divergence on the 1-hour chart. On the daily timeframe, SOL remains well below its longer-term moving averages, with the EMA200 at $115.47 representing significant overhead resistance. The immediate support structure sits around $86.50-$86.80, while a break above $88.00 could trigger a test of $90.00. The current consolidation pattern suggests SOL is building energy for its next move, with volume declining as the price tightens, typically a precursor to increased volatility.
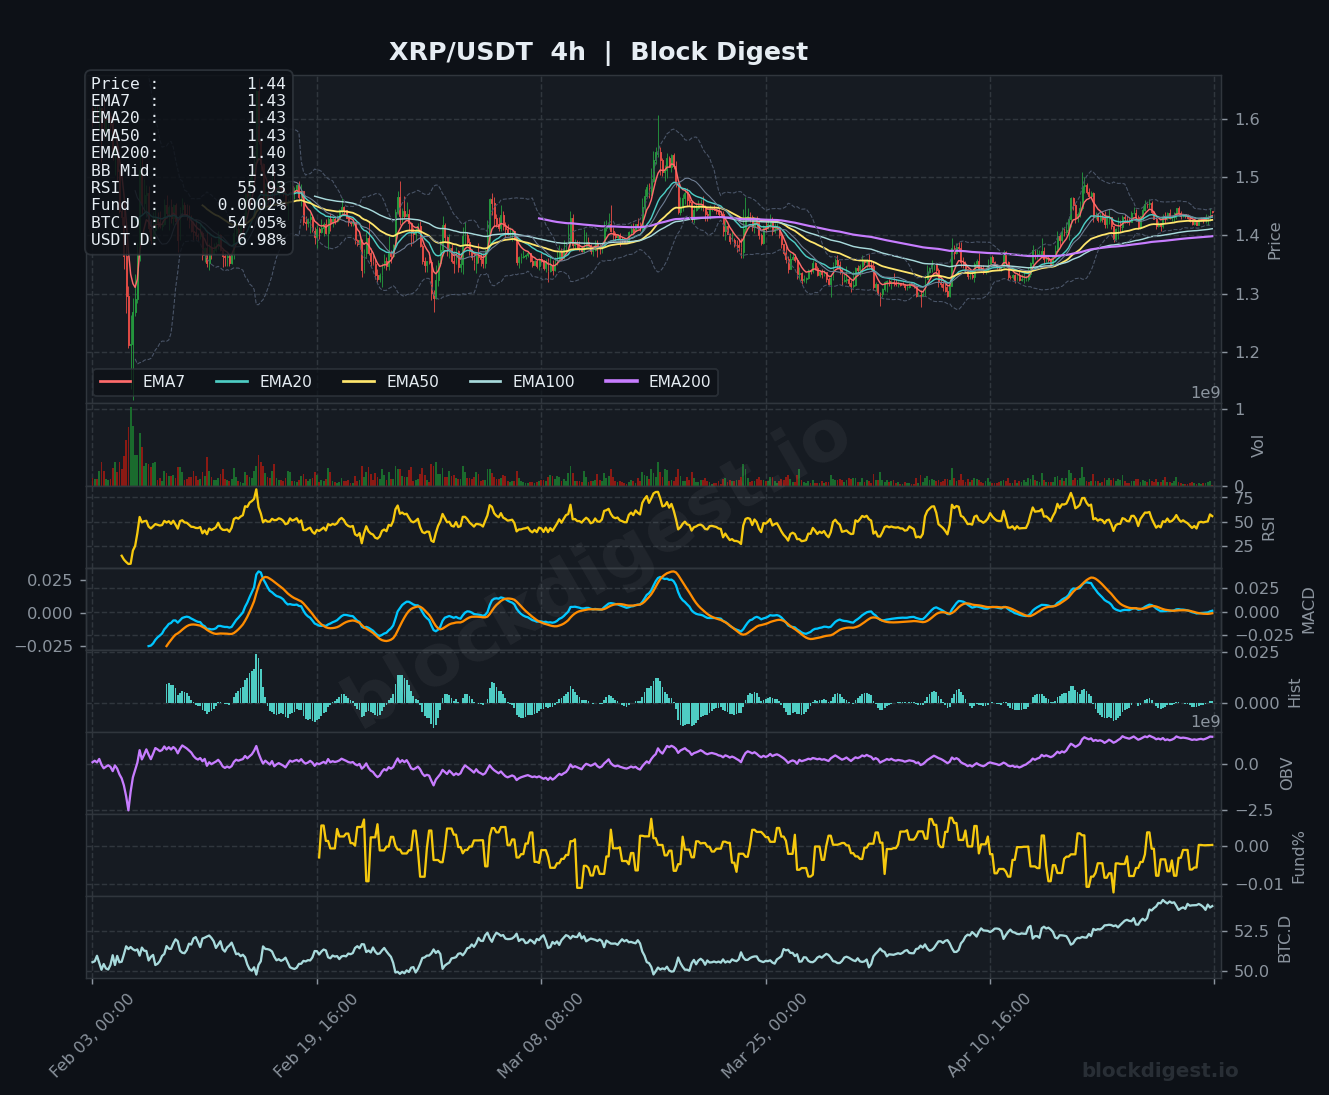
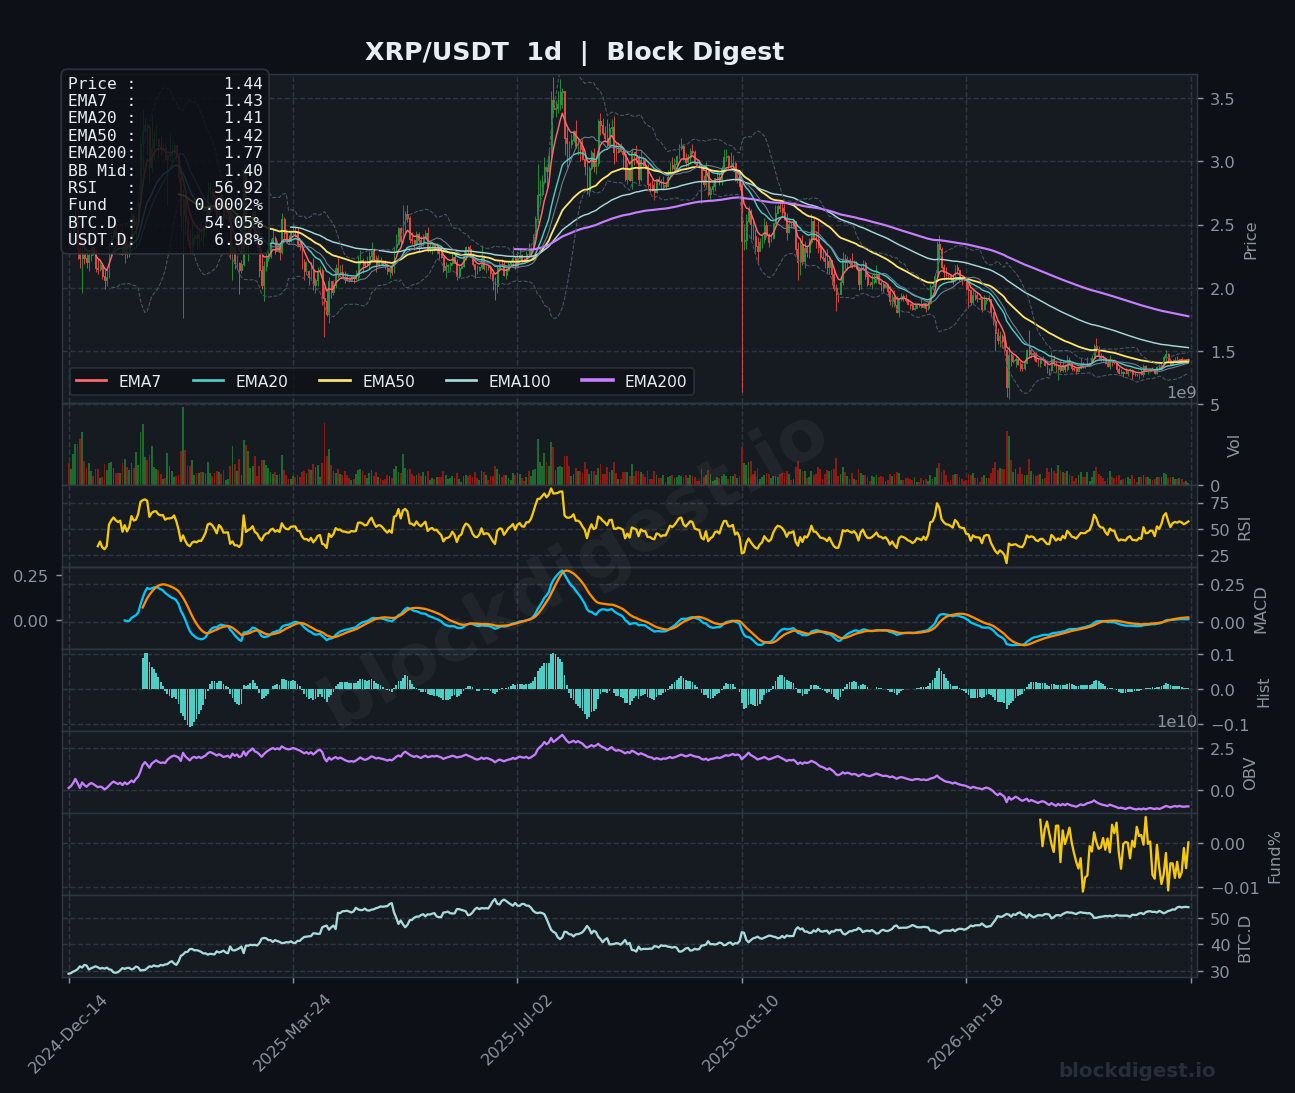
## XRP (XRP)
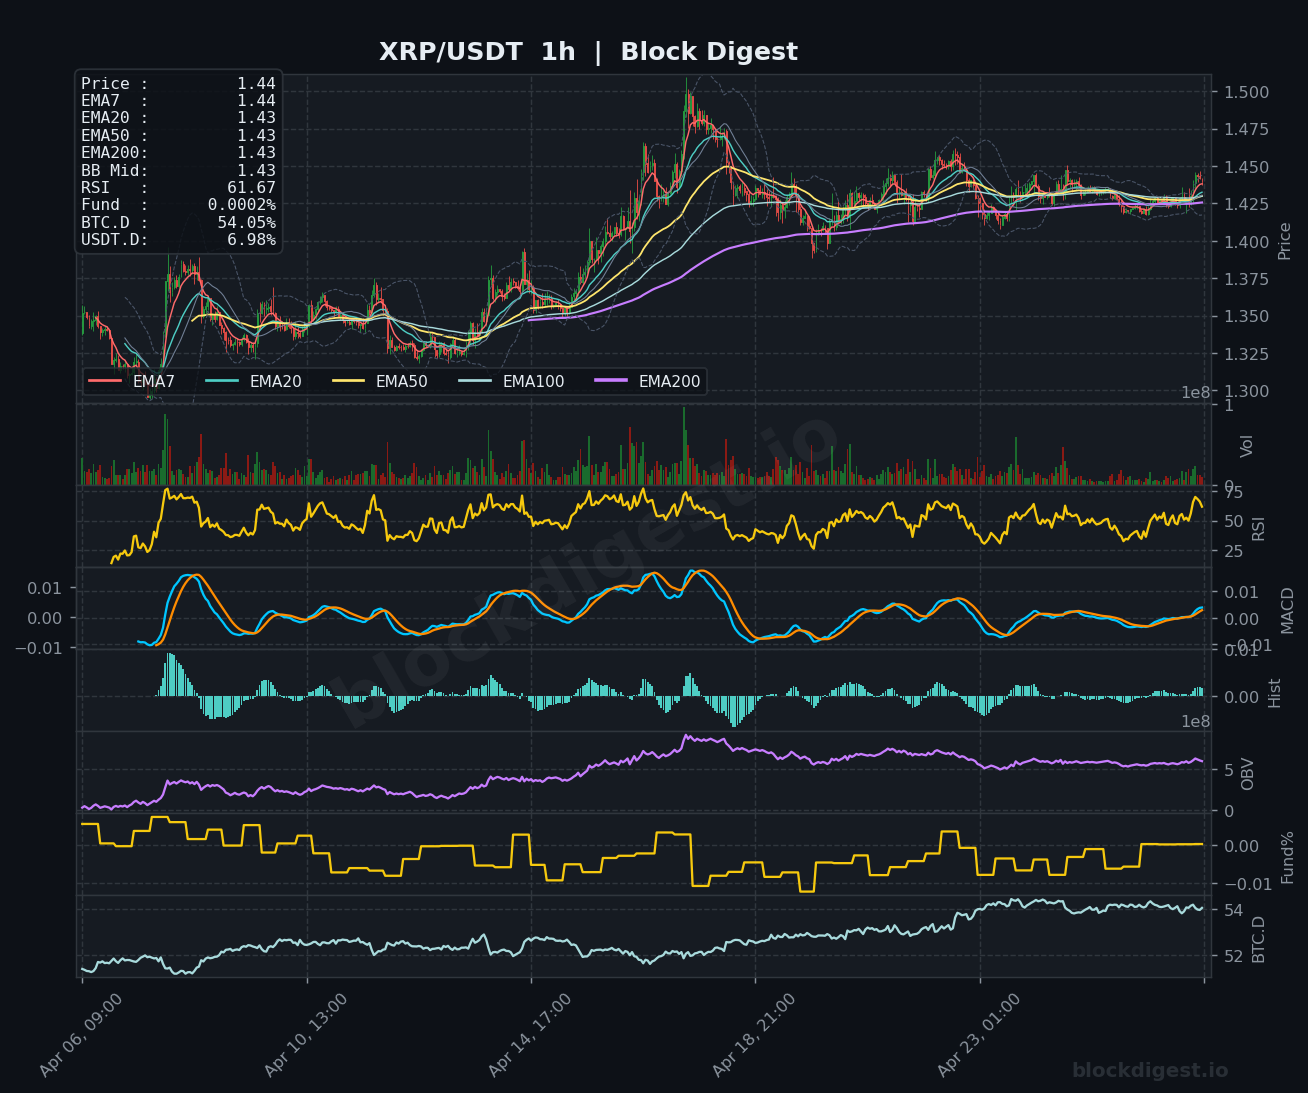
XRP is currently priced at $1.44, trading in a narrow range with all short-term EMAs converging between $1.43-$1.44, indicating a period of equilibrium. The RSI reading of 61.67 suggests neutral-to-bullish momentum, while the MACD on the 1-hour and 4-hour charts shows minimal separation, reflecting the current consolidation phase. The daily chart reveals XRP is still significantly below its EMA200 at $1.77, highlighting the longer-term downtrend that began in mid-2025. Immediate support is established at $1.42, with the Bollinger Band middle line at $1.43 providing dynamic support. A decisive break above $1.45 could open the path toward $1.48-$1.50, while failure to hold current levels may result in a retest of the $1.40 psychological level where buyers previously stepped in.
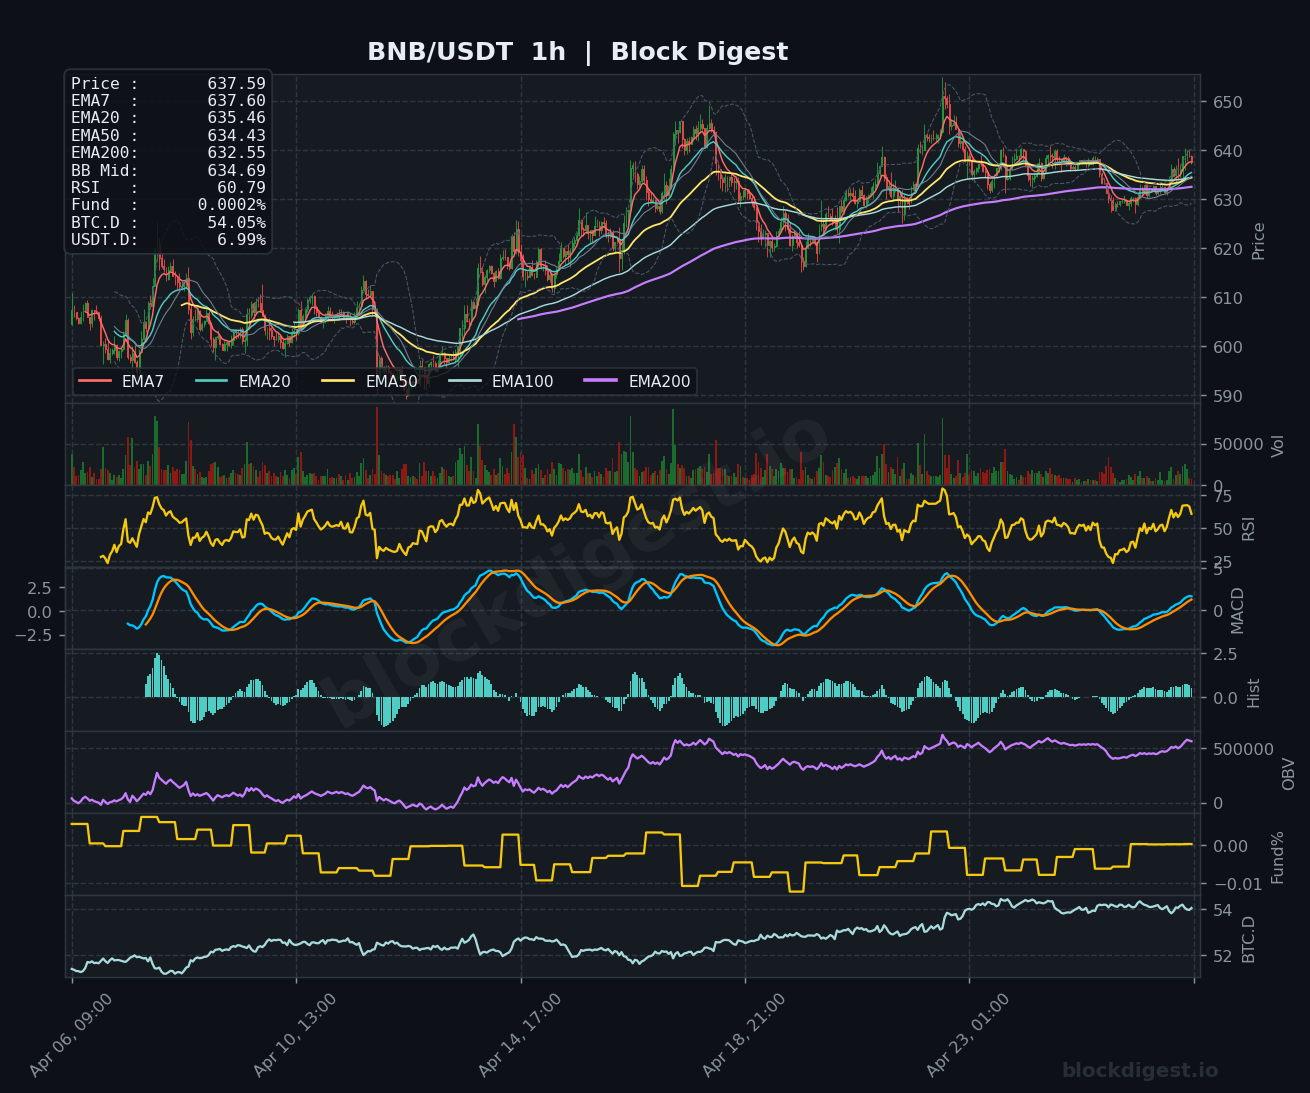
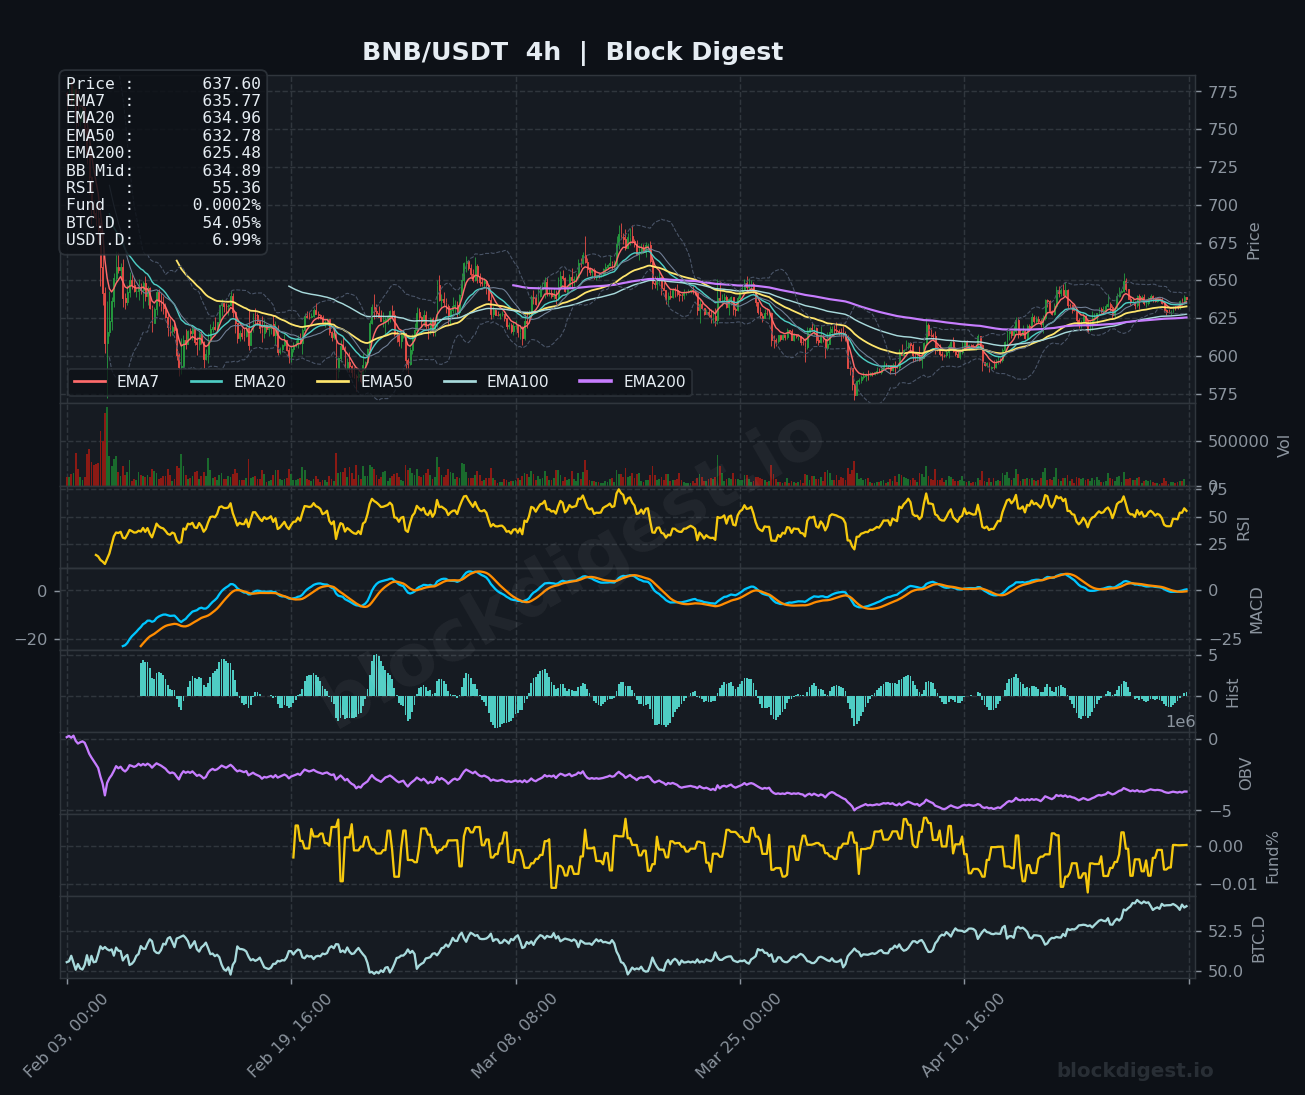
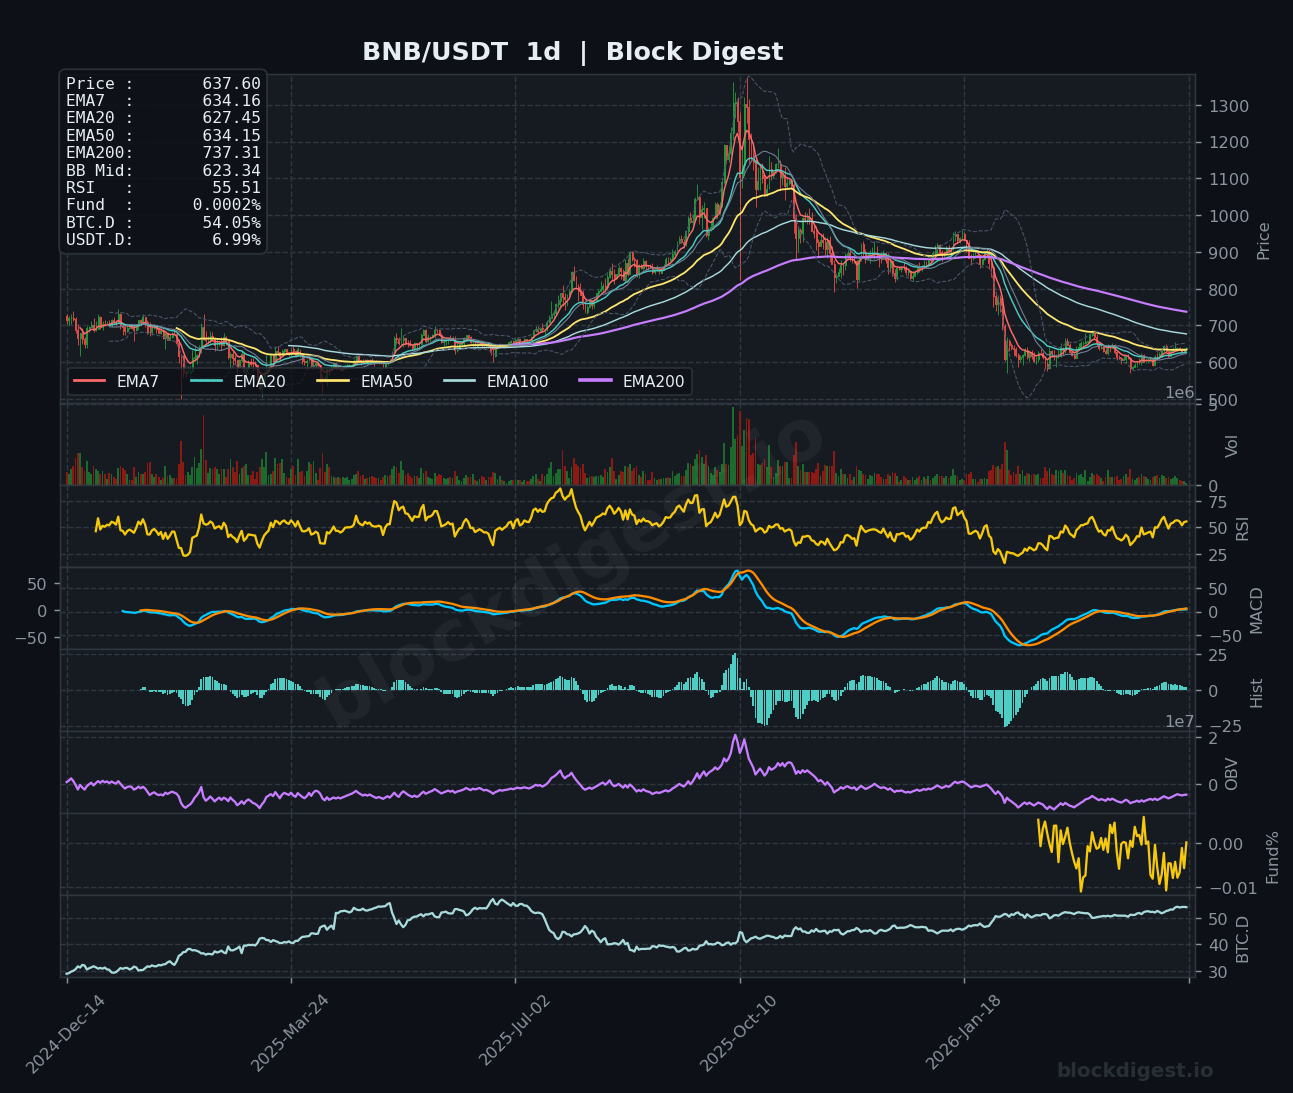
## BNB (BNB)
BNB is trading at $637.59, showing relative strength compared to other major altcoins with price action maintaining above most short-term moving averages. The RSI at 60.79 indicates healthy bullish momentum without being overextended, while the MACD histogram shows positive but declining momentum on the 4-hour timeframe. On the daily chart, BNB faces significant resistance from the descending EMA200 at $737.31, a level that has capped rallies since the market correction began. The immediate support zone lies between $630-$634, where the EMA50 and EMA20 are currently positioned. A sustained move above $640 could target the $650 resistance level, while a breakdown below $630 may lead to a retest of the $620 support area where buyers have previously shown interest.
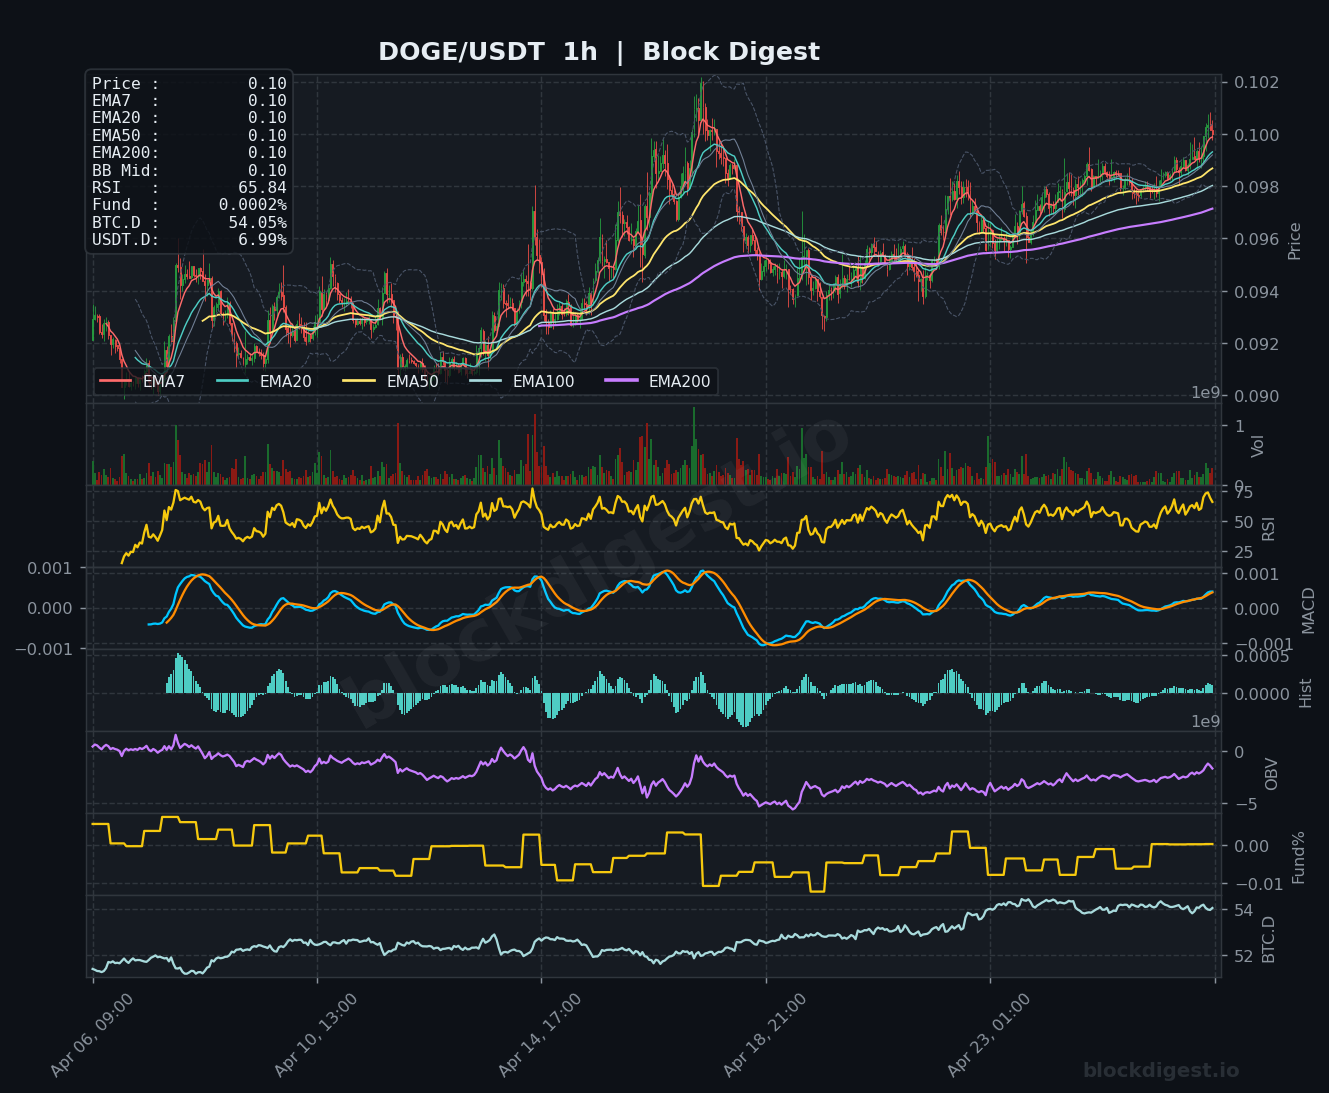
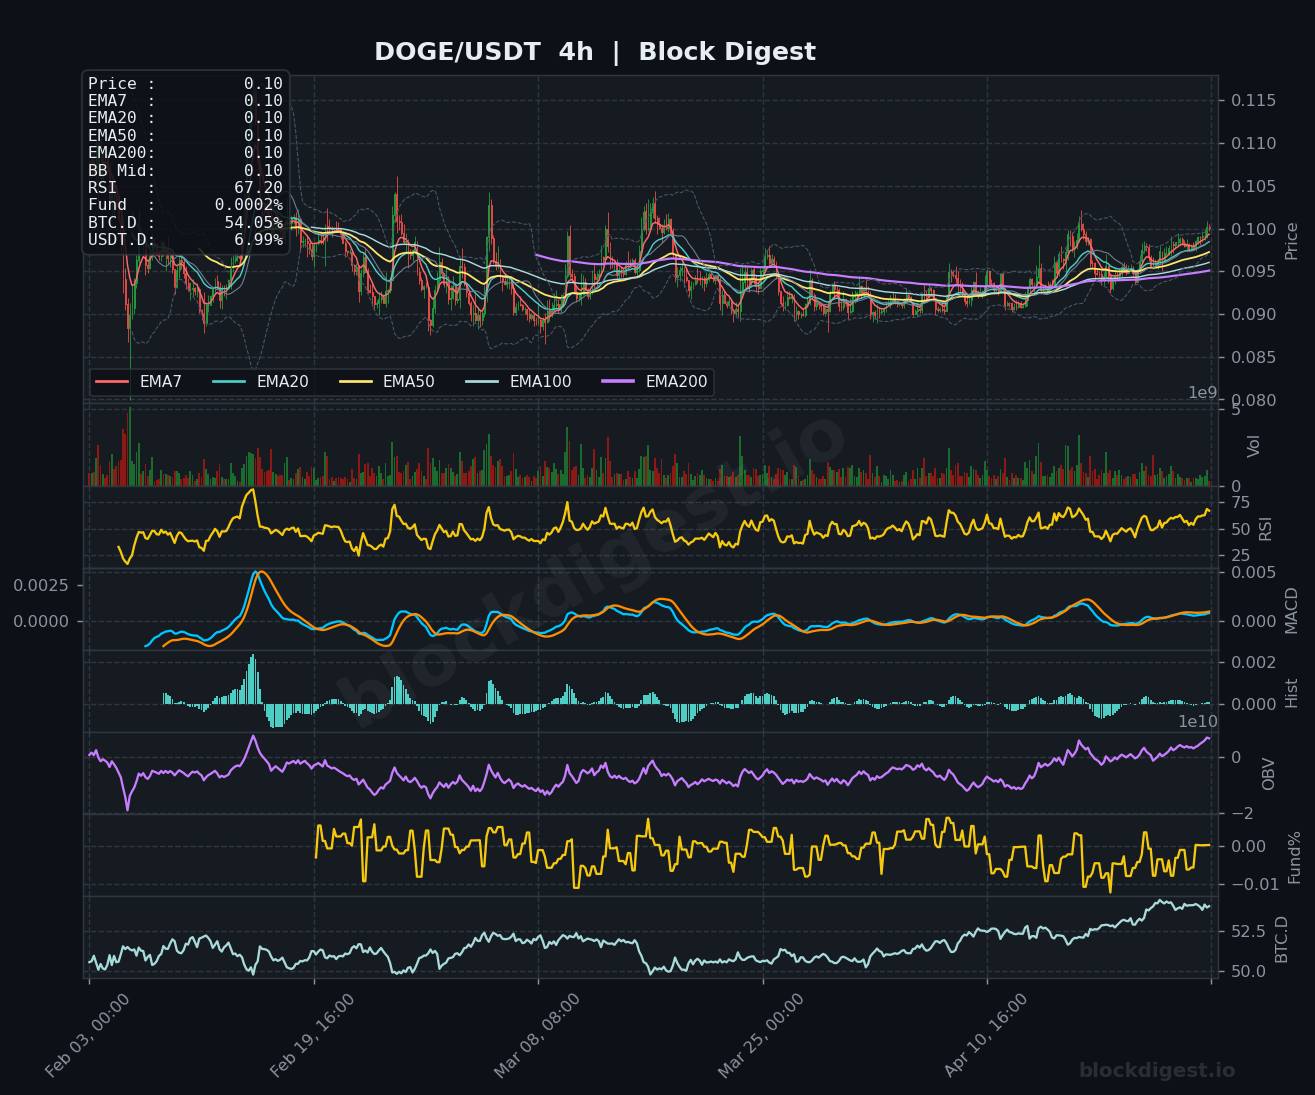
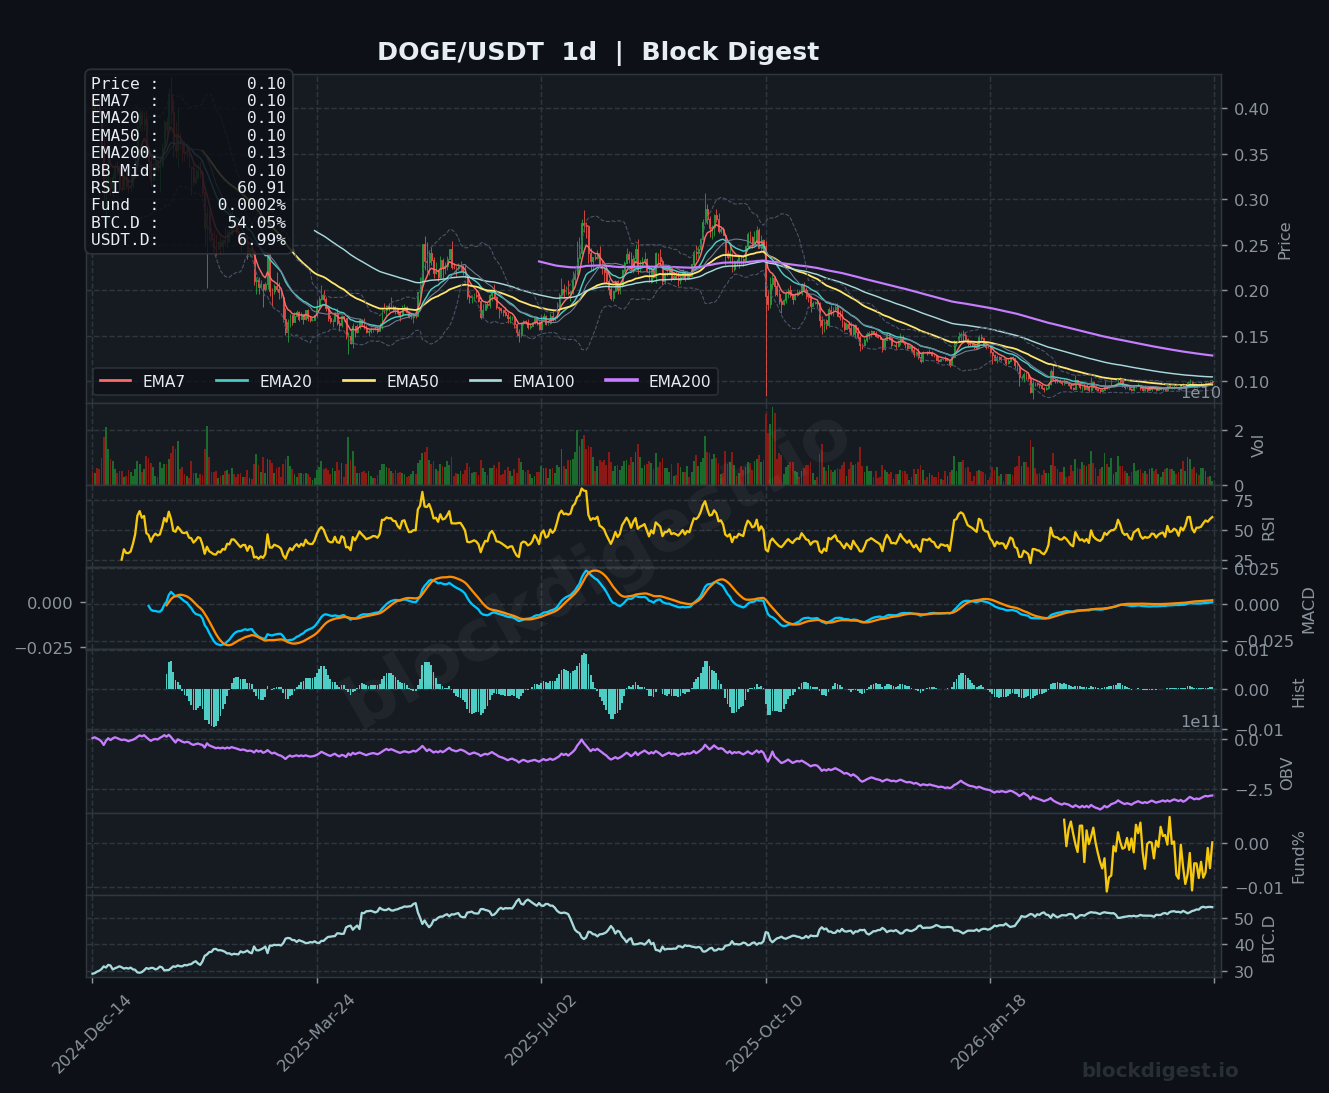
## Dogecoin (DOGE)
Dogecoin is trading at $0.1045, displaying one of the stronger short-term setups among major altcoins with price action well above all key moving averages. The RSI at 65.84 shows solid bullish momentum, while the MACD continues to trend positively on both the 1-hour and 4-hour charts, indicating sustained buying pressure. The daily timeframe reveals DOGE has been in a gradual uptrend since early 2026, though it remains significantly below its EMA200 at $0.13. Immediate support is established at $0.10 (psychological level) with additional backing from the EMA20 at $0.10. A break above $0.1050 could accelerate toward $0.1070-$0.1080, while any pullback should find buyers near the $0.10 level. The histogram pattern suggests accumulation continues, supporting the current upward bias.
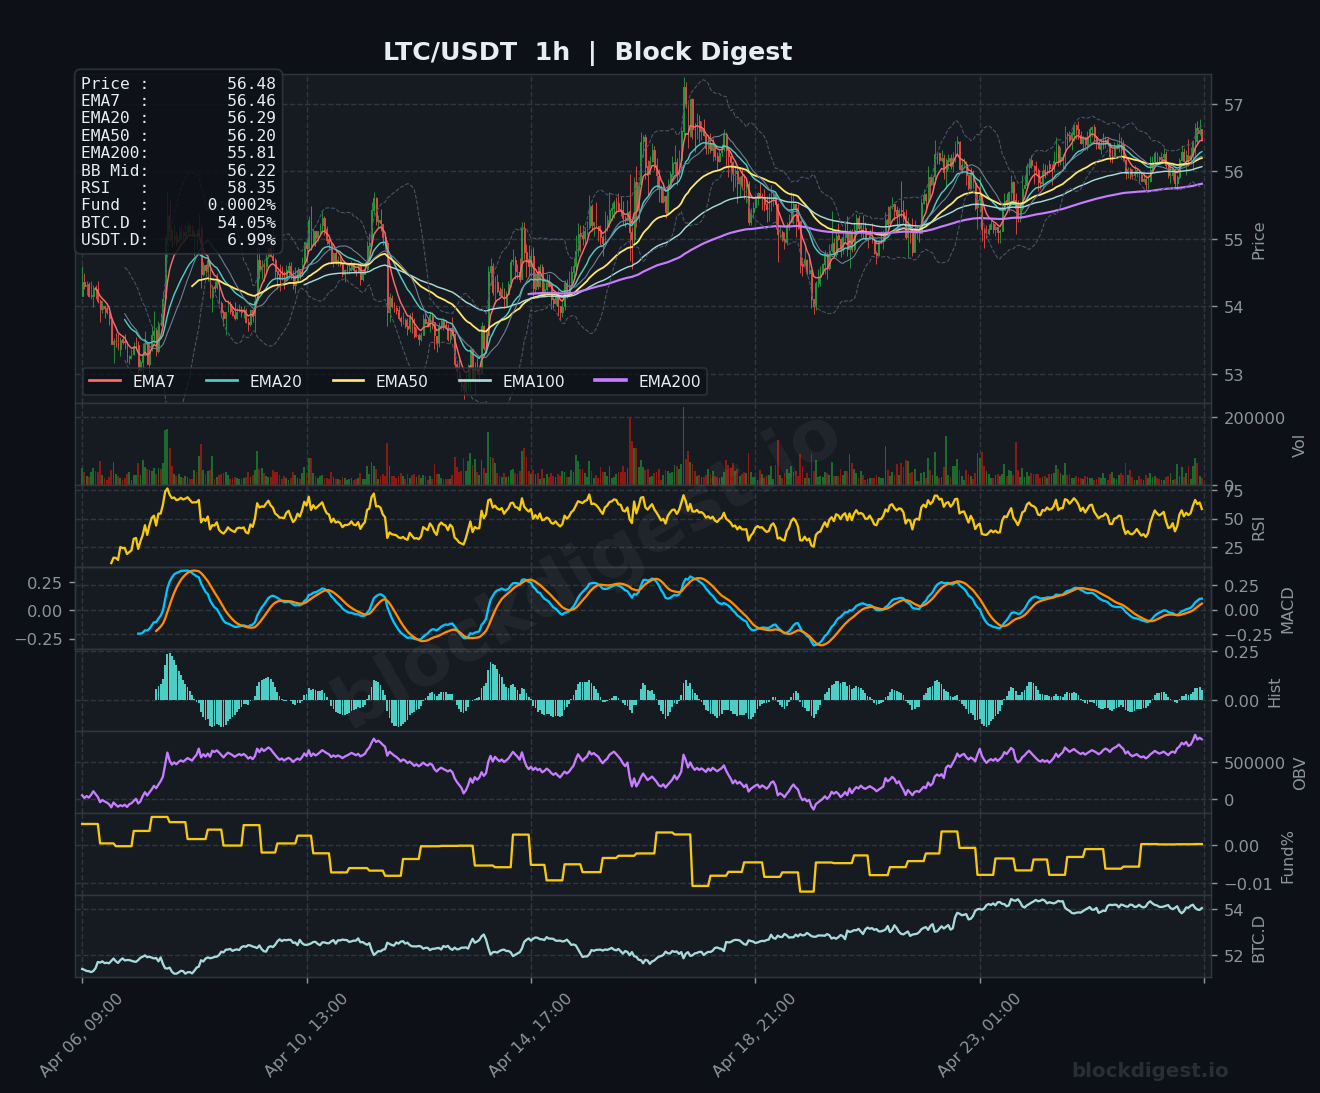
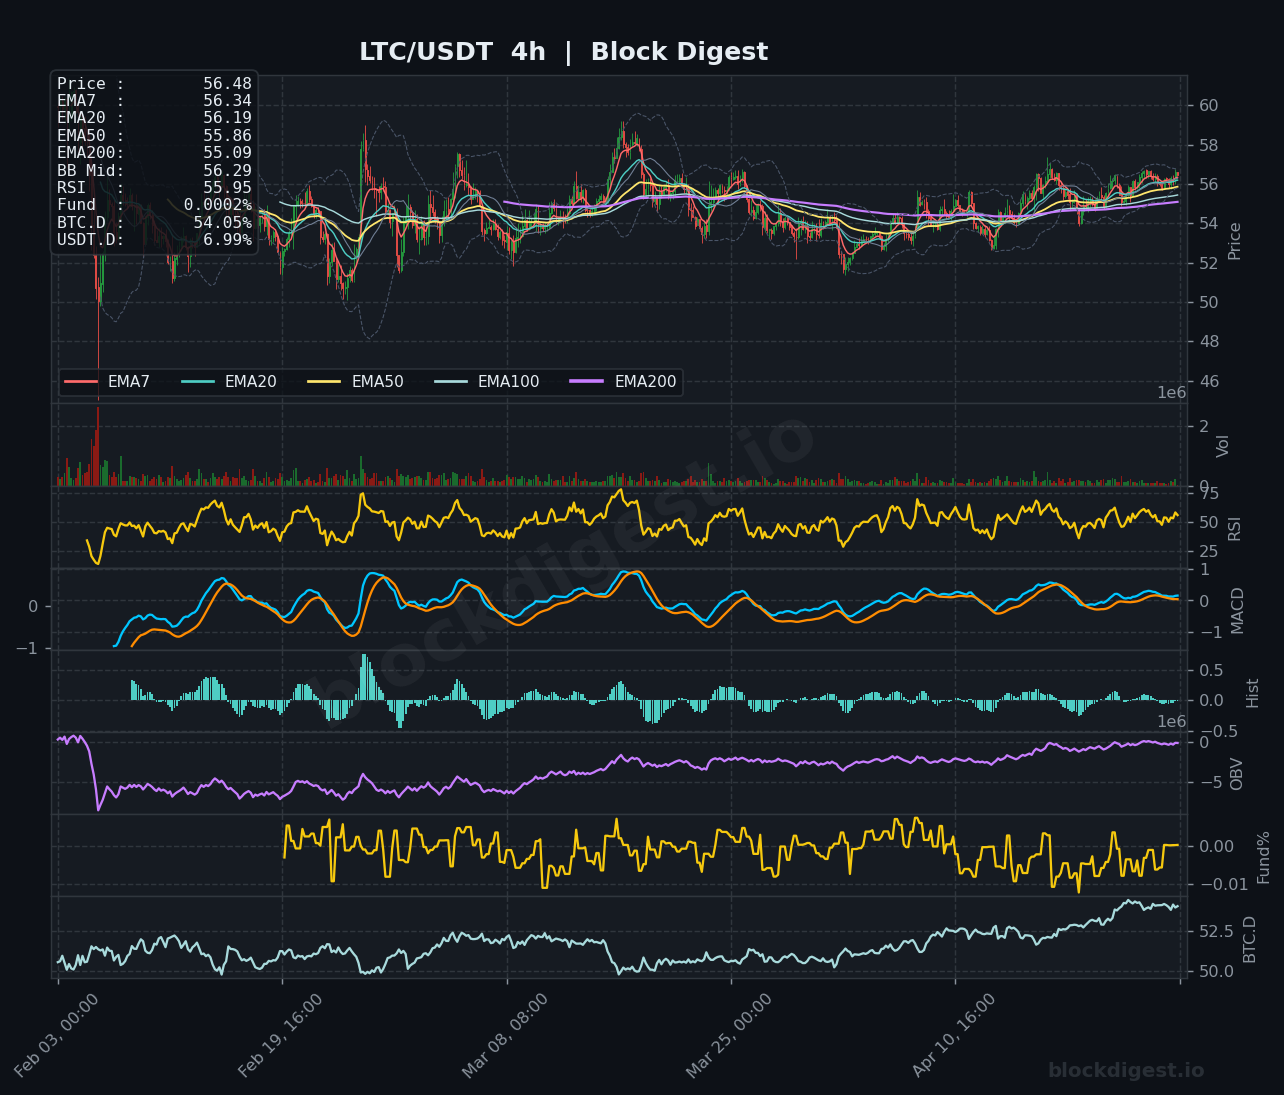
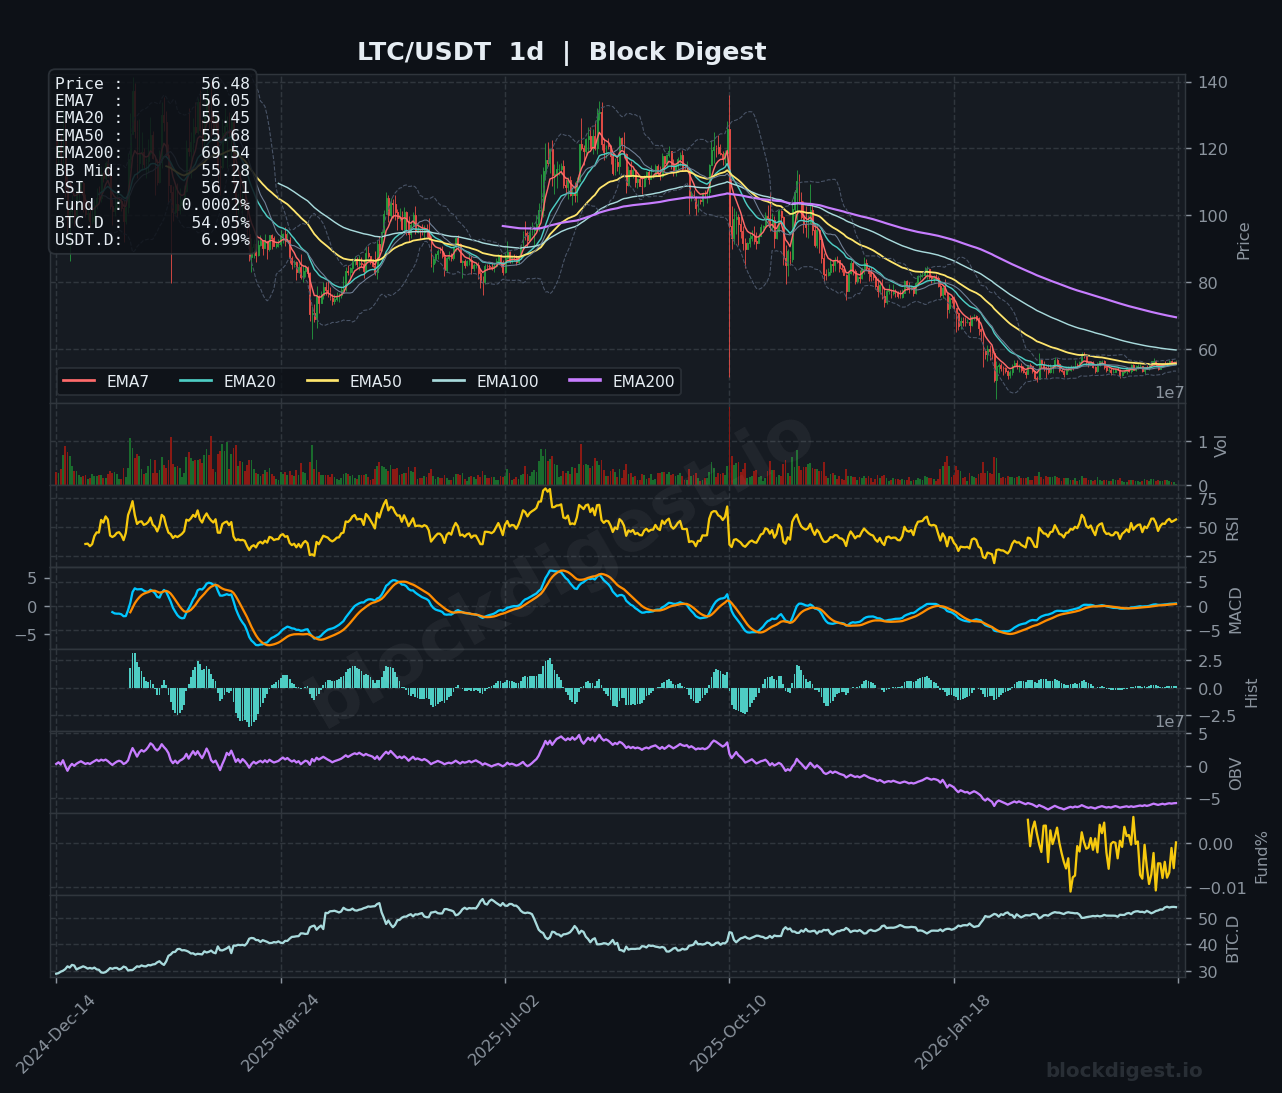
## Litecoin (LTC)
LTC is currently priced at $56.48, trading in a tight range with short-term moving averages clustered between $56.05-$56.46, reflecting a market in consolidation mode. The RSI reading of 58.35 indicates neutral momentum with a slight bullish tilt, while the MACD shows minimal momentum on the 1-hour and 4-hour timeframes. On the daily chart, LTC faces formidable resistance from the EMA200 at $69.54, representing a 23% premium from current levels. The immediate support structure sits at $55.80-$56.00, where the EMA50 and previous swing lows align. A breakout above $57.00 could trigger a move toward $57.50-$58.00, while a breakdown below $56.00 may lead to a retest of the $55.00 psychological support. Volume has been declining during this consolidation, suggesting a larger move may be imminent once the range breaks.
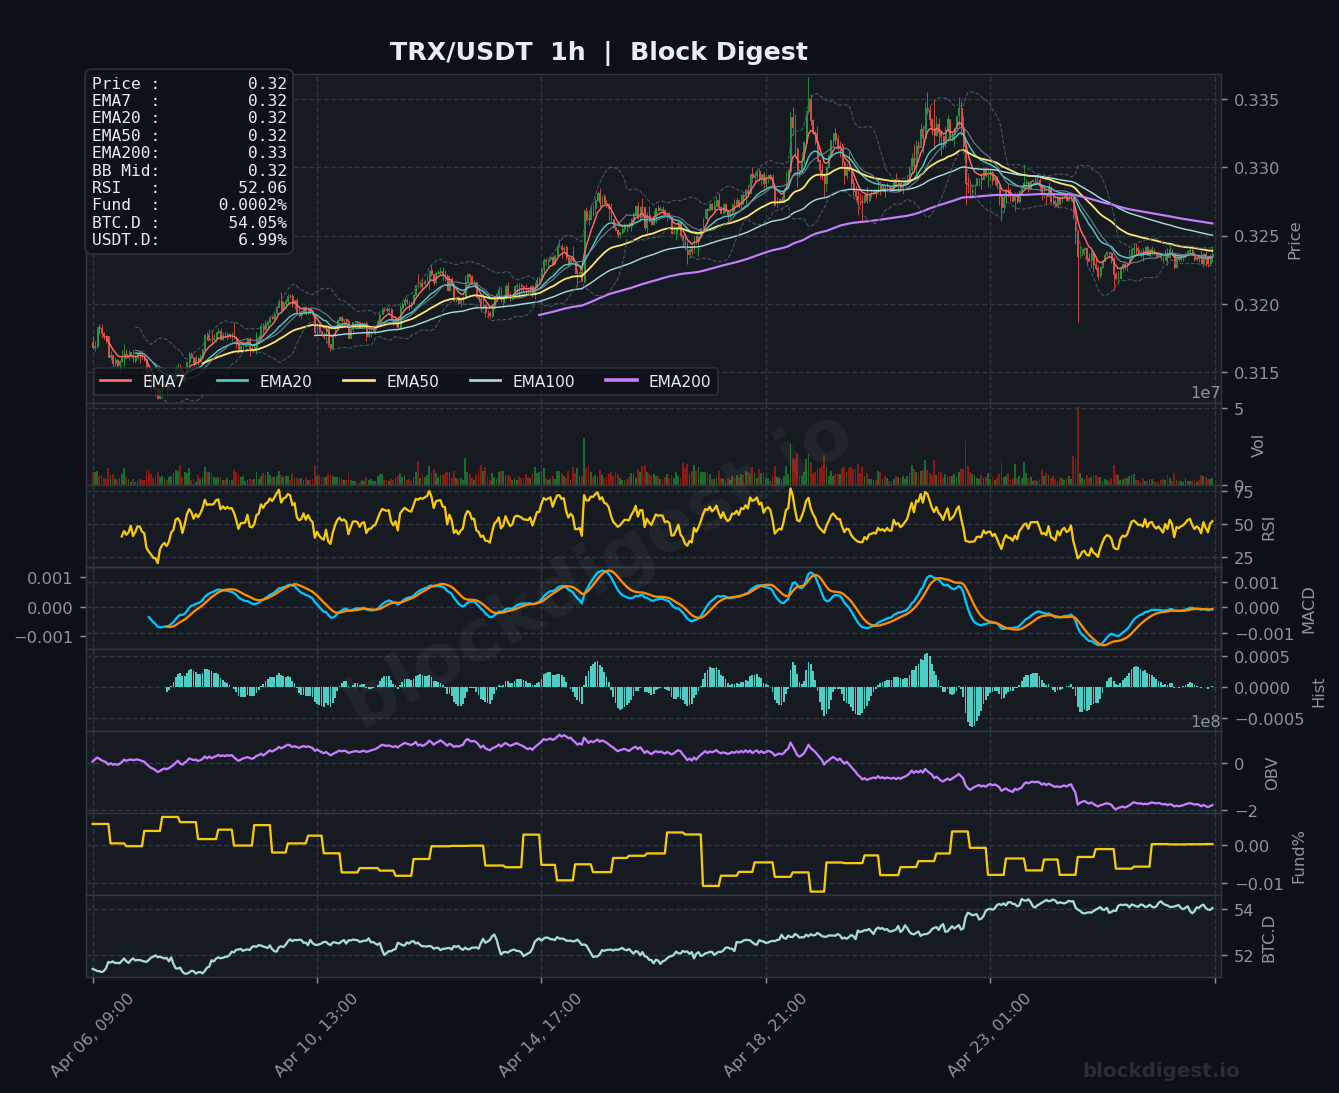
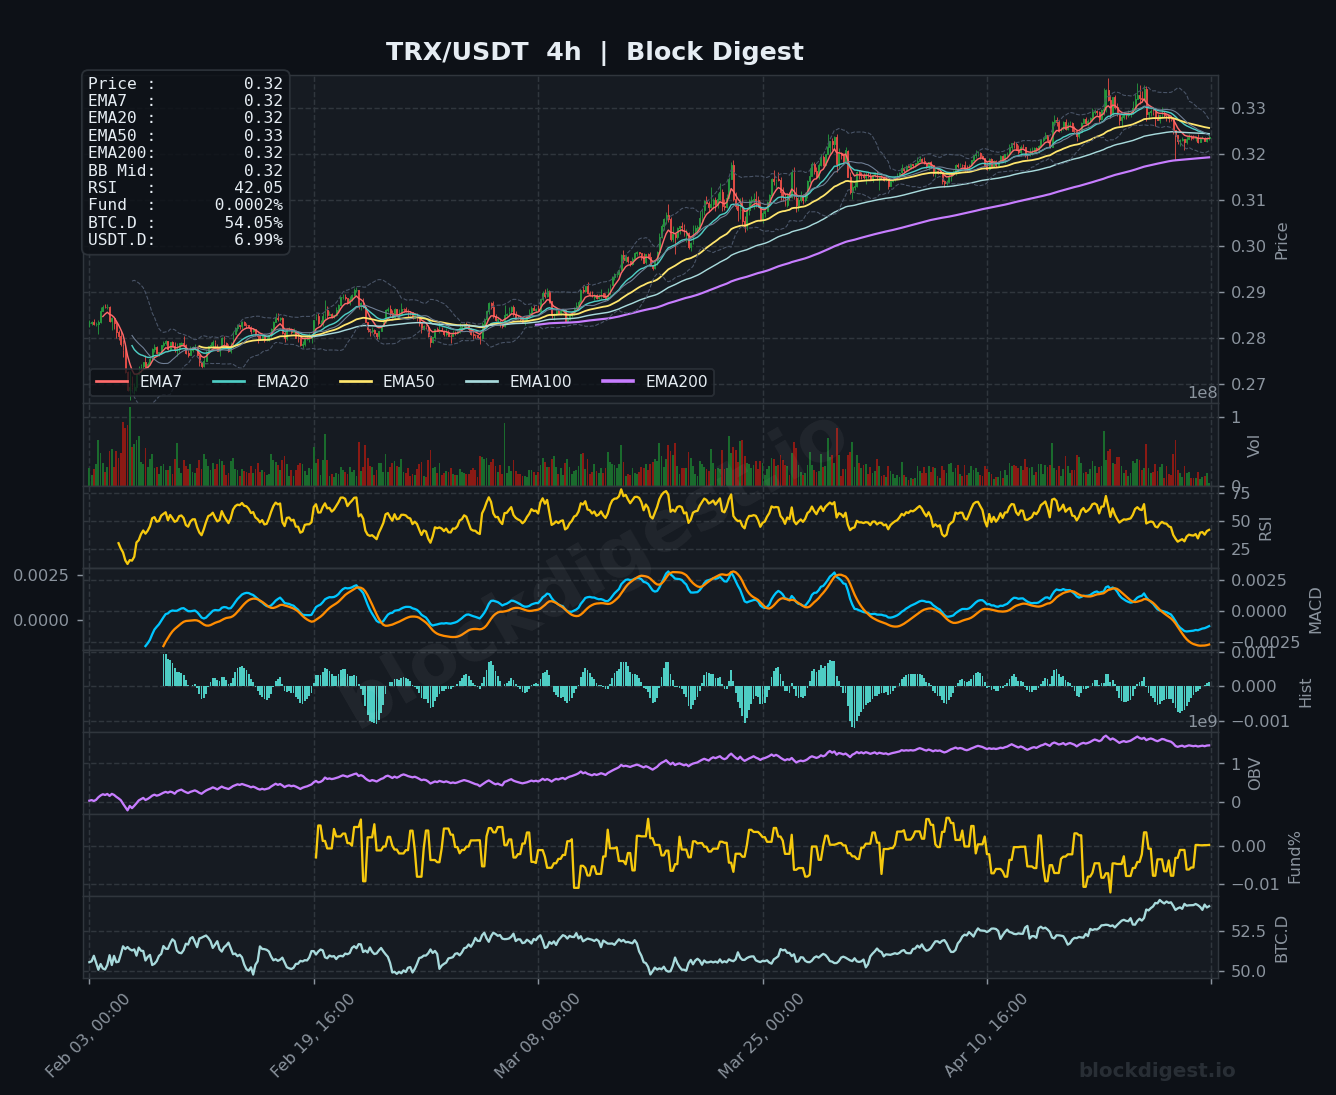
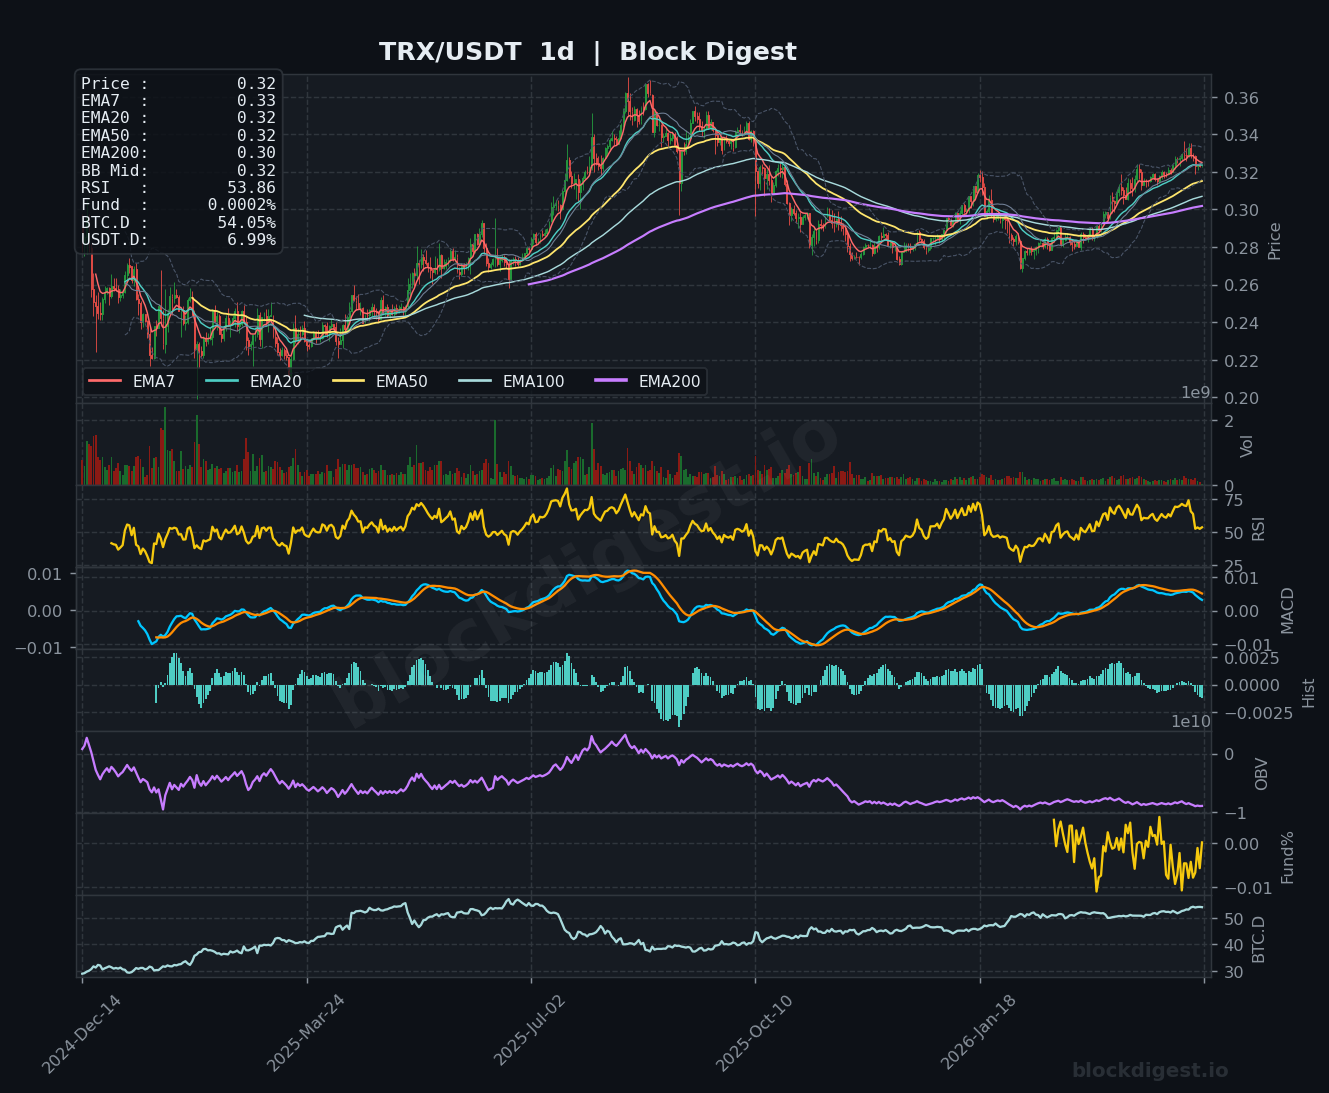
## TRON (TRX)
TRON is trading at $0.3241, showing weakness compared to other major altcoins with the price recently rejected from higher levels and now testing support. The RSI at 52.06 indicates neutral momentum following the recent pullback from overbought conditions, while the MACD on the 4-hour chart has crossed bearish, suggesting near-term downside pressure. The daily timeframe shows TRX is still above its key moving averages, with the EMA50 at $0.32 providing immediate support. A break below $0.32 could accelerate declines toward $0.31, where the EMA200 at $0.30 would provide stronger support. Conversely, a reclaim of $0.325 could stabilize the price and set up a potential retest of $0.33. The histogram pattern on the daily chart shows declining buying pressure, warranting caution for bulls in the near term.
## Altcoin Outlook
The altcoin market is currently characterized by consolidation and range-bound trading across most major assets, with DOGE showing the most constructive technical setup while TRX displays relative weakness. The convergence of short-term moving averages across multiple assets suggests the market is coiling for a significant move in either direction, likely triggered by Bitcoin’s next major impulse or macro catalysts. Traders should watch for volume expansion and decisive breaks of current ranges, with particular attention to the $87-$88 level on SOL, $1.45 on XRP, and $640 on BNB as key inflection points. The moderate RSI readings across most assets provide room for movement in both directions, making risk management and defined entry/exit levels crucial in the current environment.
Charts