ALTCOIN Daily Analysis — 2026-07-28 (Full Archive)
Market Context
The altcoin market is navigating a challenging environment as BTC dominance holds firm at 55.21%, continuing to siphon capital away from the broader altcoin space and leaving most majors struggling to build sustained upside momentum. USDT.D at 8.15% signals that a meaningful portion of market participants remains parked in stablecoins, reflecting cautious positioning rather than active risk-on deployment. Block Digest’s BD Pulse score sits at a bearish 39/100, a reading that aligns with the subdued price action visible across virtually all six assets covered today — consolidation and soft selling pressure are the dominant themes heading into the week’s close.
Solana (SOL)
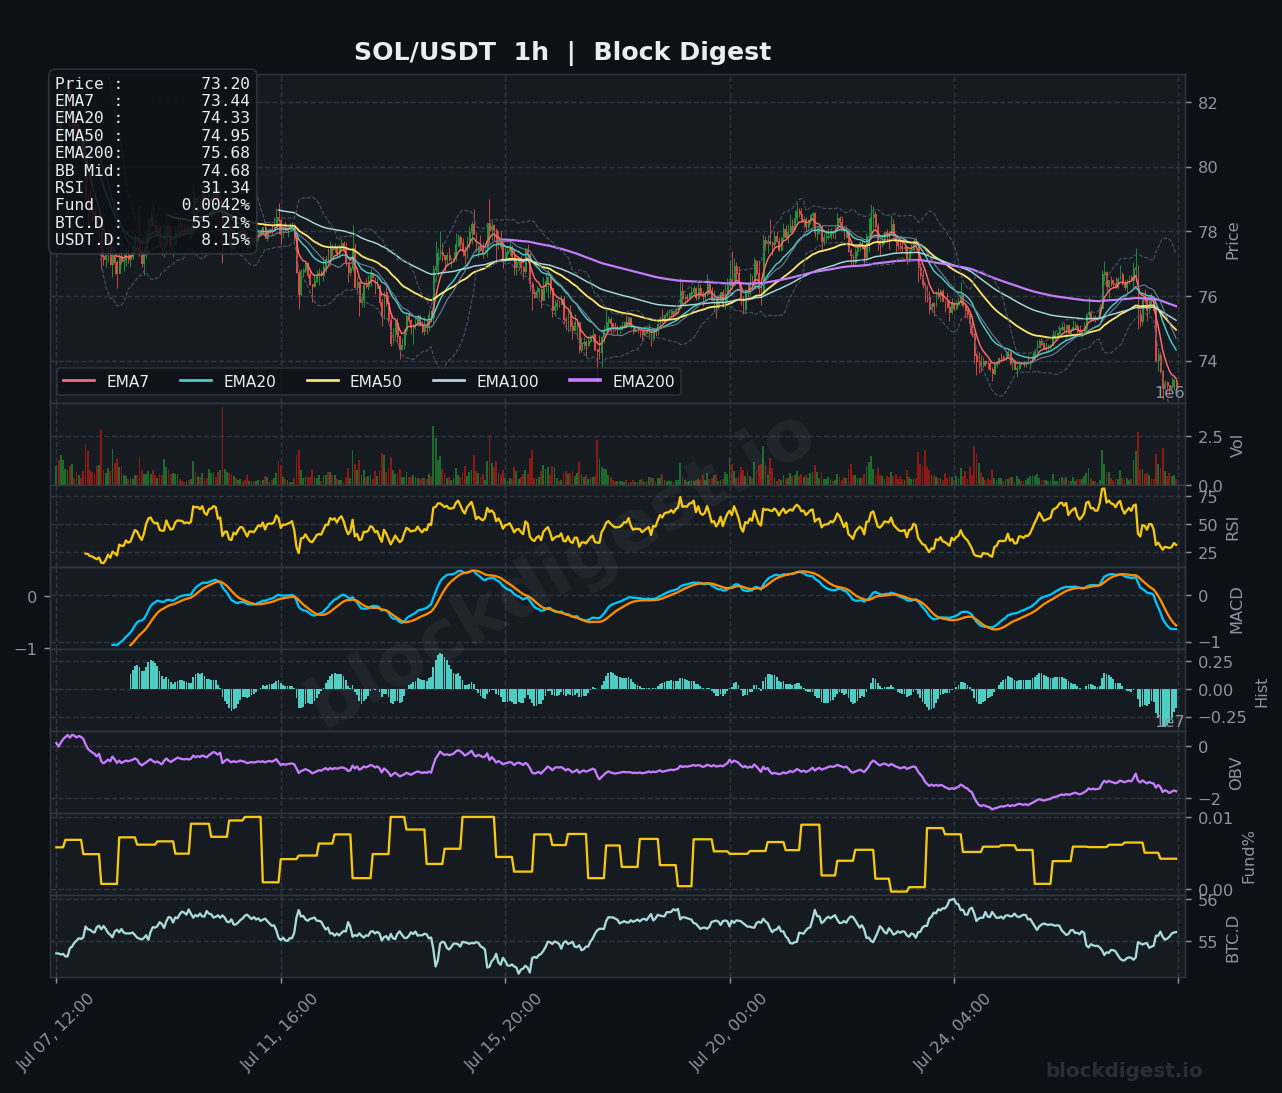
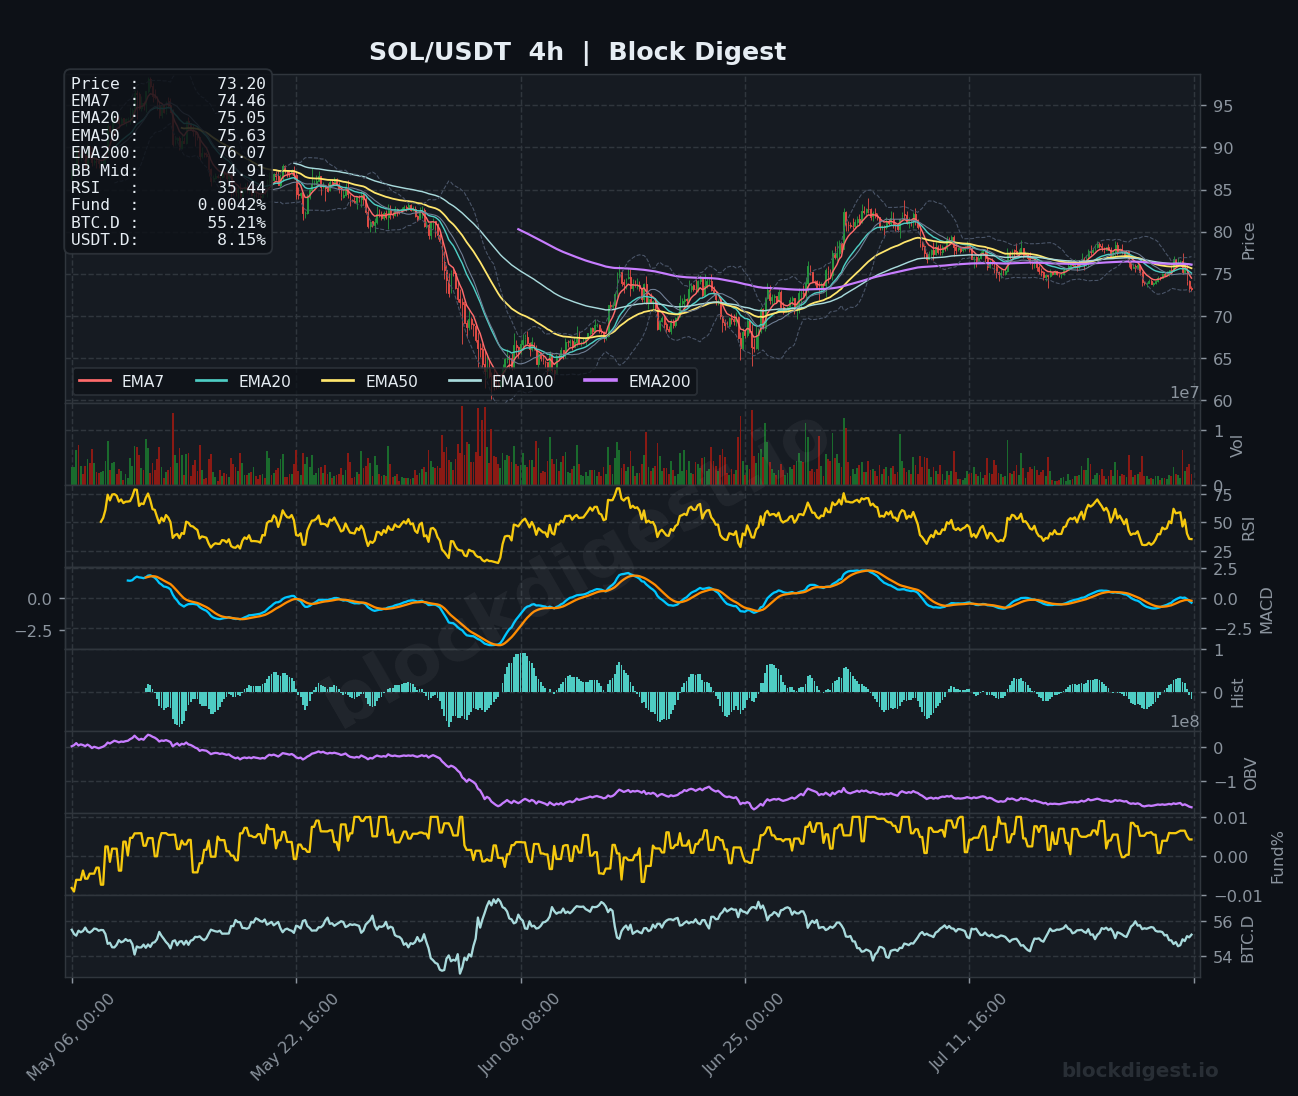
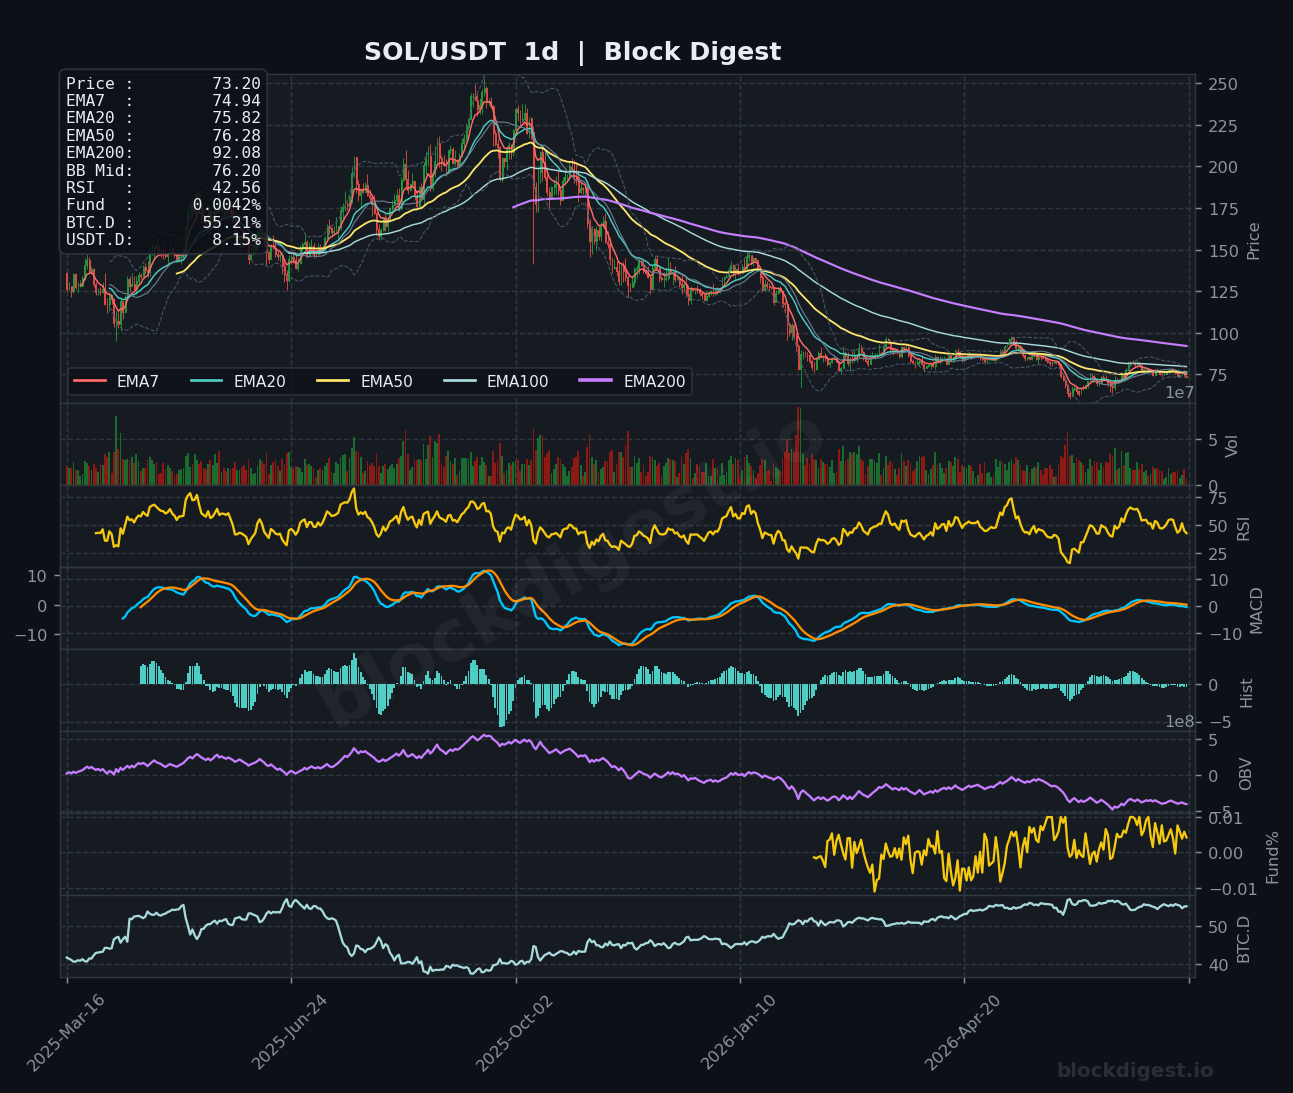
SOL is trading at $73.20, having slipped beneath all major EMAs on the 1h chart — the EMA7 at $73.44, EMA20 at $74.33, EMA50 at $74.95, and EMA200 at $75.68 are all stacked bearishly above price, forming a dense resistance cluster that bulls need to reclaim to change near-term tone. The 1h RSI at 31.34 is approaching oversold territory, and the MACD has crossed firmly negative with a deepening histogram, suggesting sell-side pressure has not fully exhausted itself. On the daily chart, the RSI sits at 42.56 with price still well beneath the descending EMA200 at $92.08, painting a structurally weak longer-term picture as the OBV trend continues to slope downward — consistent with Block Digest’s own OBV Trend reading of -1. The $72–$73 zone is acting as immediate support; a decisive break below risks a test of the $68–$70 demand area, while recovery above $75.70 is required before any bullish re-rating is warranted.
XRP (XRP)
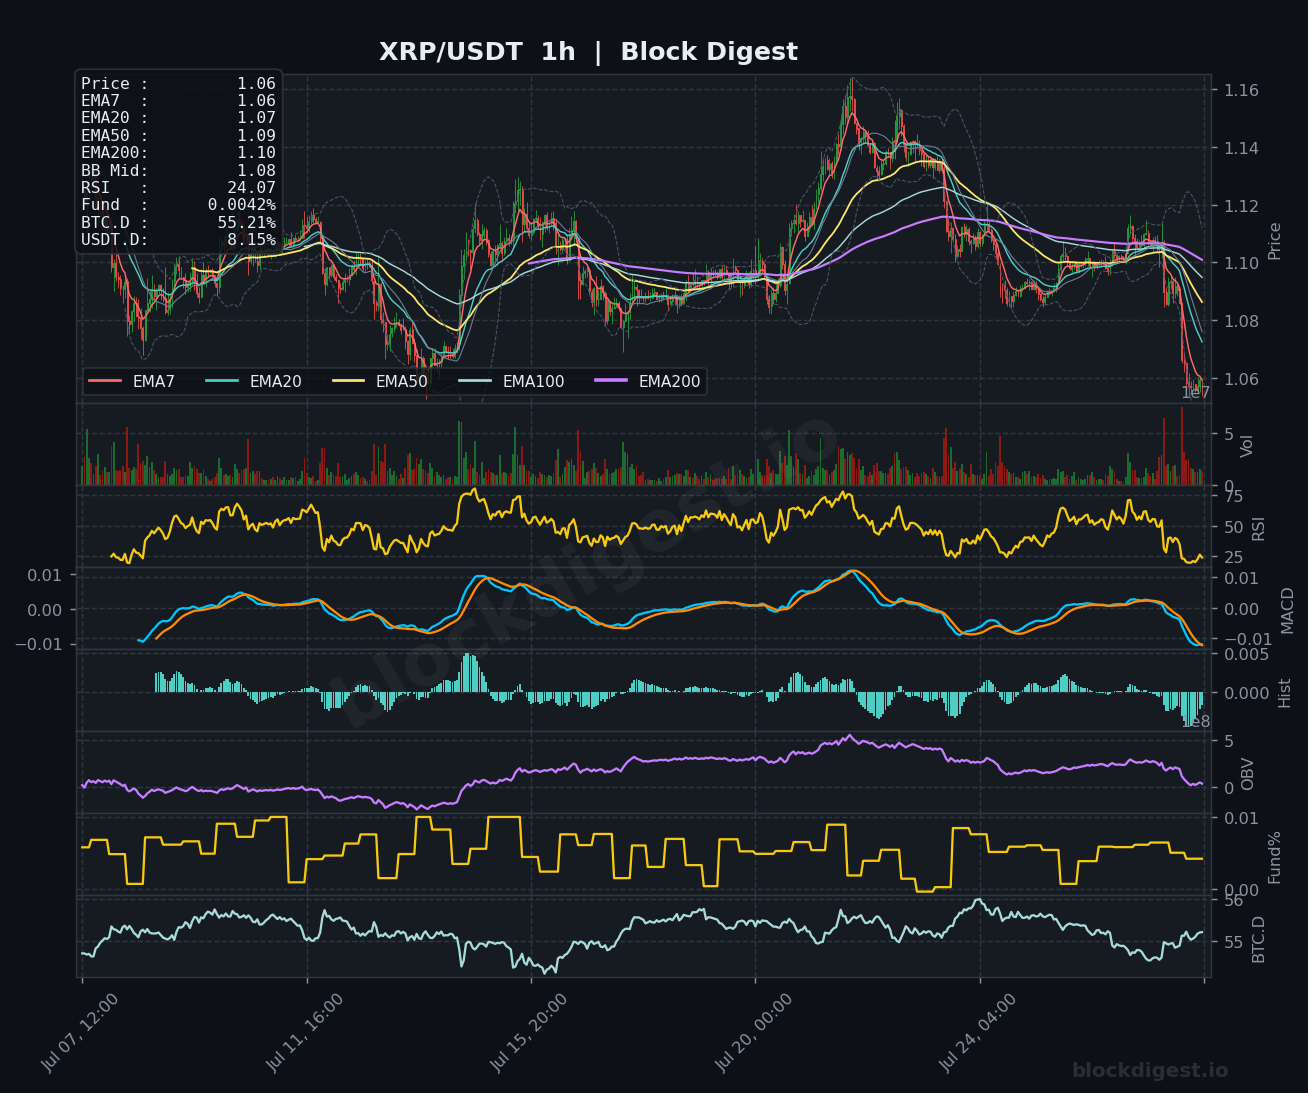
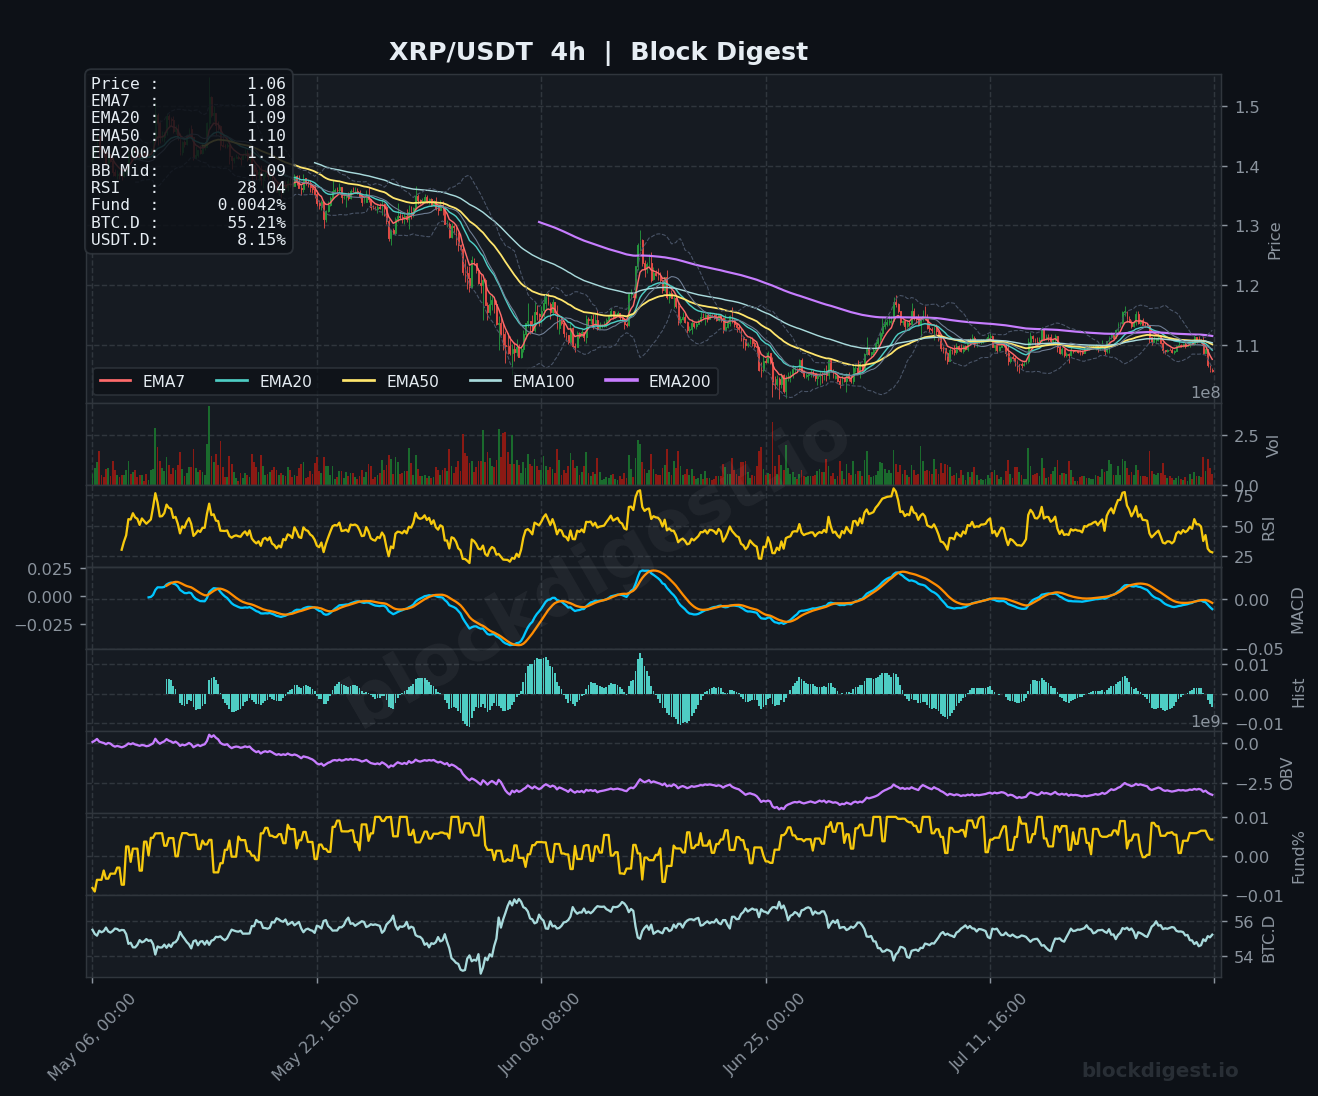
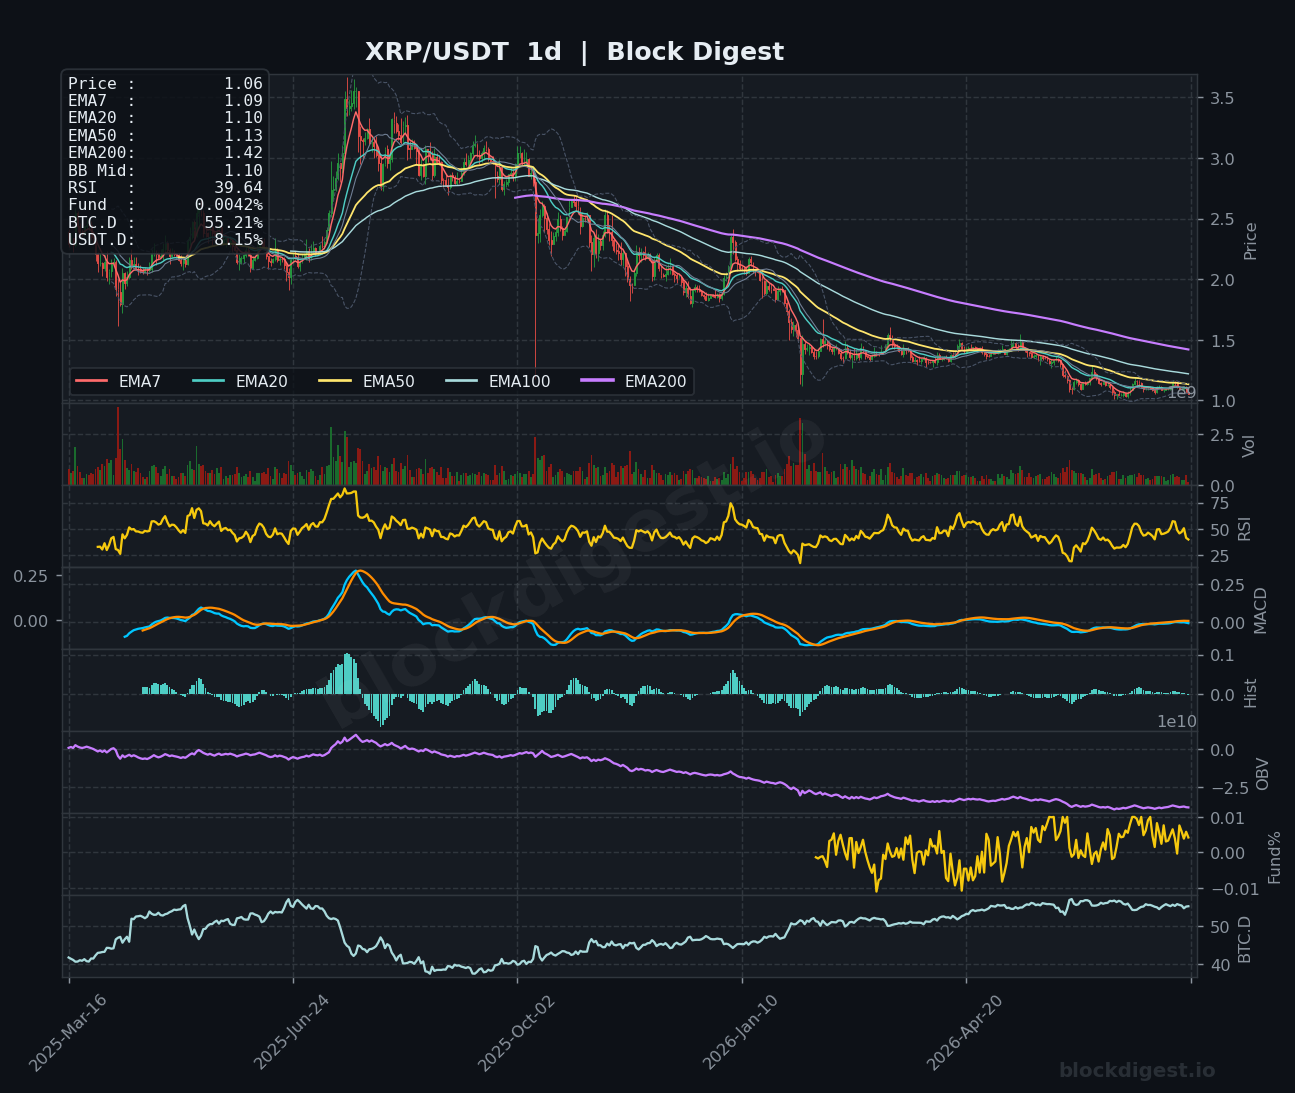
XRP has dropped sharply to $1.06, with the 1h chart showing price crashing below all major moving averages and an RSI at an extremely oversold 24.07 — one of the most distressed short-term readings across today’s covered assets. The 4h RSI at 28.04 confirms the severity of the recent move, though oversold readings alone are not a buy signal in a market where the daily structure remains firmly bearish, with price trading under a descending EMA stack and the EMA200 at $1.42 acting as a distant ceiling. On the daily chart, RSI at 39.64 and a flattening MACD near zero suggest the long-term downtrend is grinding but has yet to form a credible base. Key support to watch is the $1.04–$1.06 zone; a hold here with improving volume could trigger a relief bounce toward $1.10–$1.12, but the broader bias remains cautiously bearish until price re-establishes above the $1.10 EMA200 level on the 1h.
BNB (BNB)
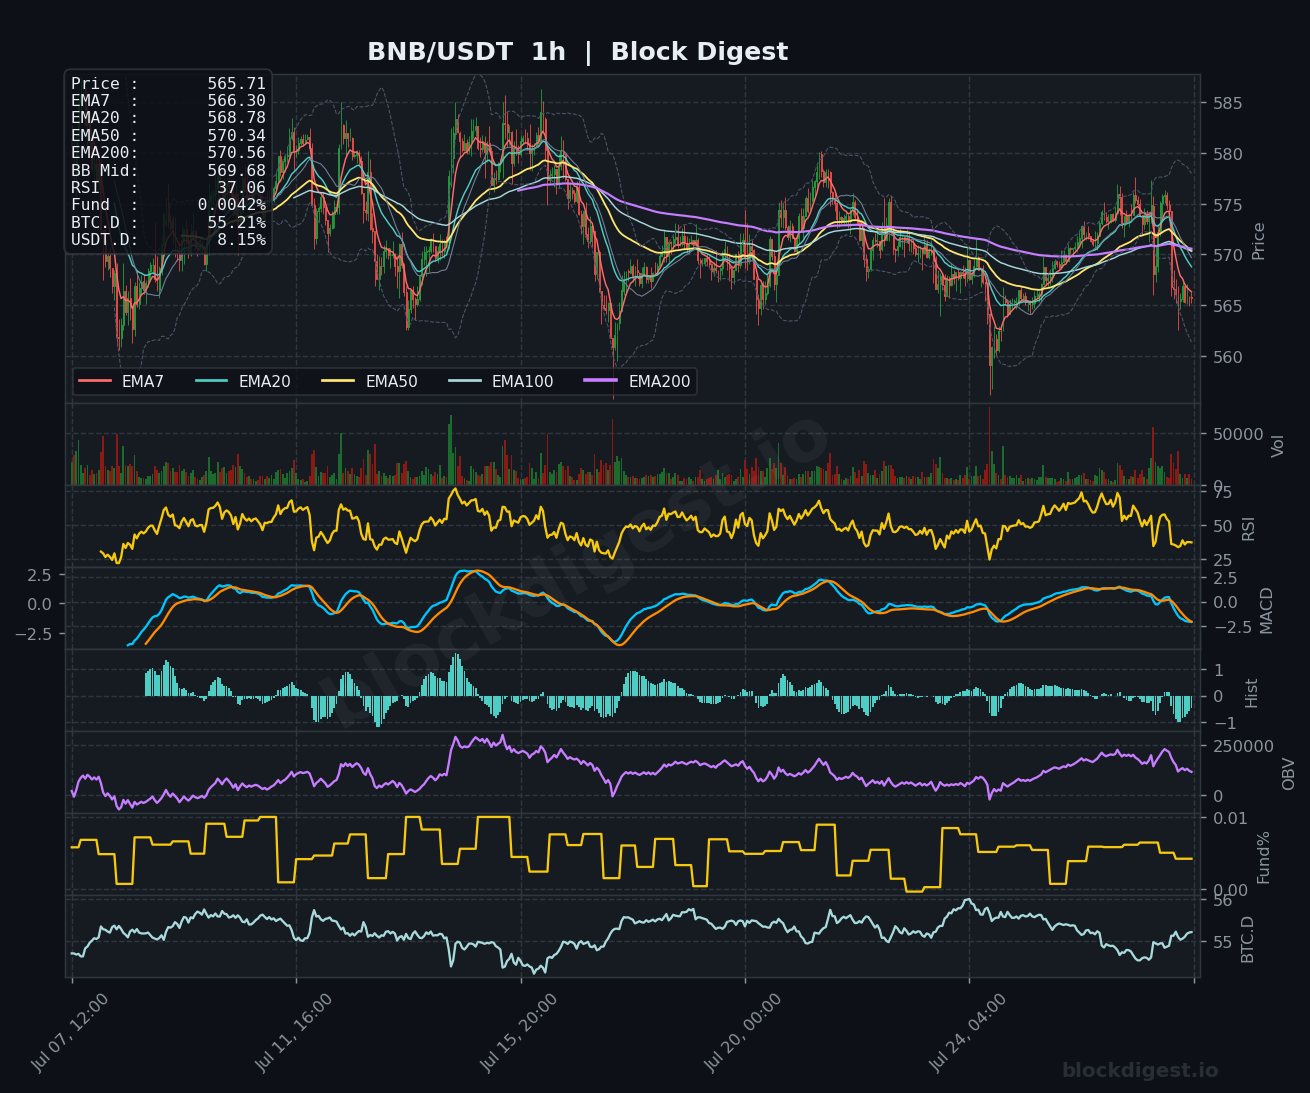
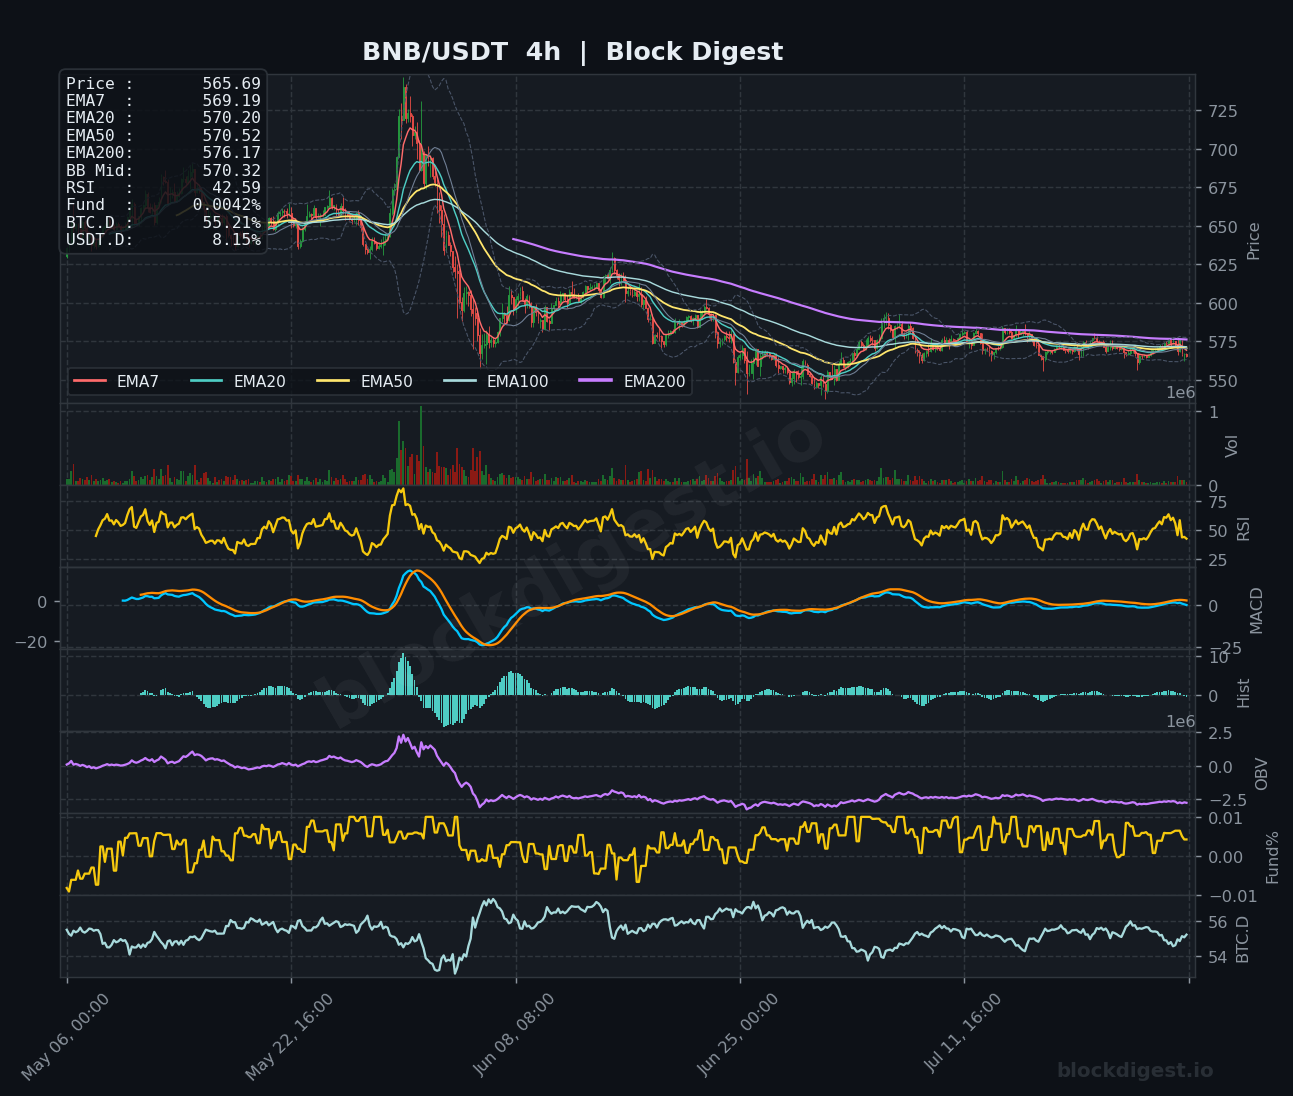
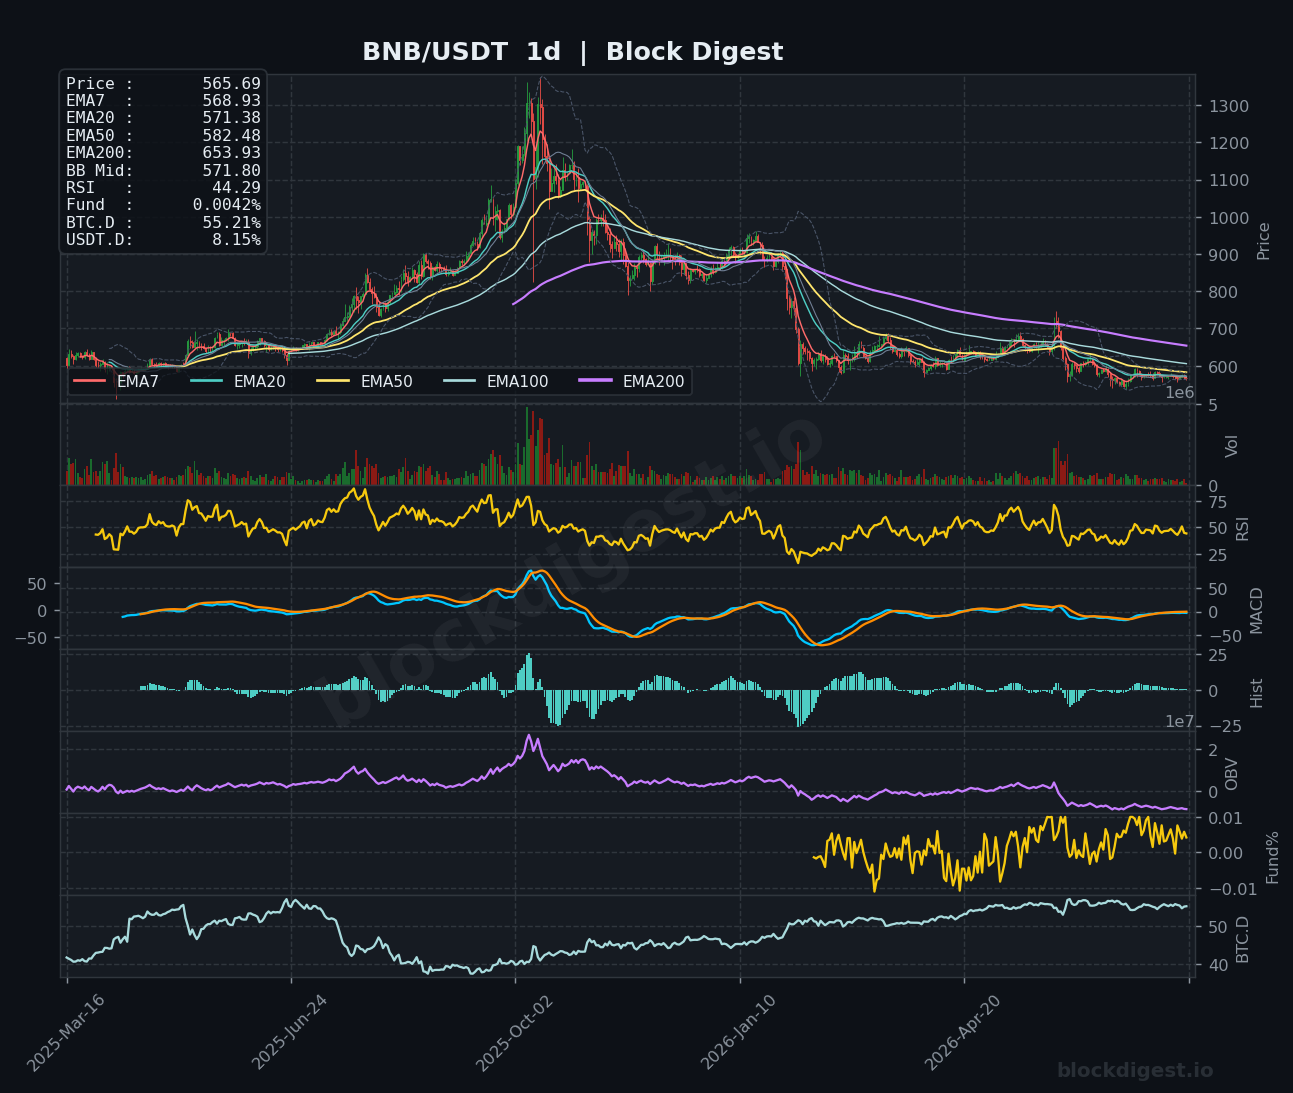
BNB is trading at $565.69, positioned beneath all short-term EMAs on the 1h chart — EMA7 at $566.30, EMA20 at $568.78, EMA50 at $570.34, and EMA200 at $570.56 — creating a tightly compressed resistance band in the $568–$571 zone that sellers have successfully defended. The 1h RSI at 37.06 and a bearish MACD histogram reflect waning momentum, while the 4h chart shows RSI at 42.59 with the MACD barely positive, indicating the medium-term recovery attempt off the mid-range lows is running out of conviction. On the daily timeframe, RSI at 44.29 and a still-declining EMA200 at $653.93 illustrate the scale of the structural damage sustained over recent months; the OBV on the 4h has remained depressed since the sharp sell-off, pointing to persistent distribution. Bulls need a clean break above $572–$575 to shift intraday bias; below $560, the next notable support sits near $548–$550.
Dogecoin (DOGE)
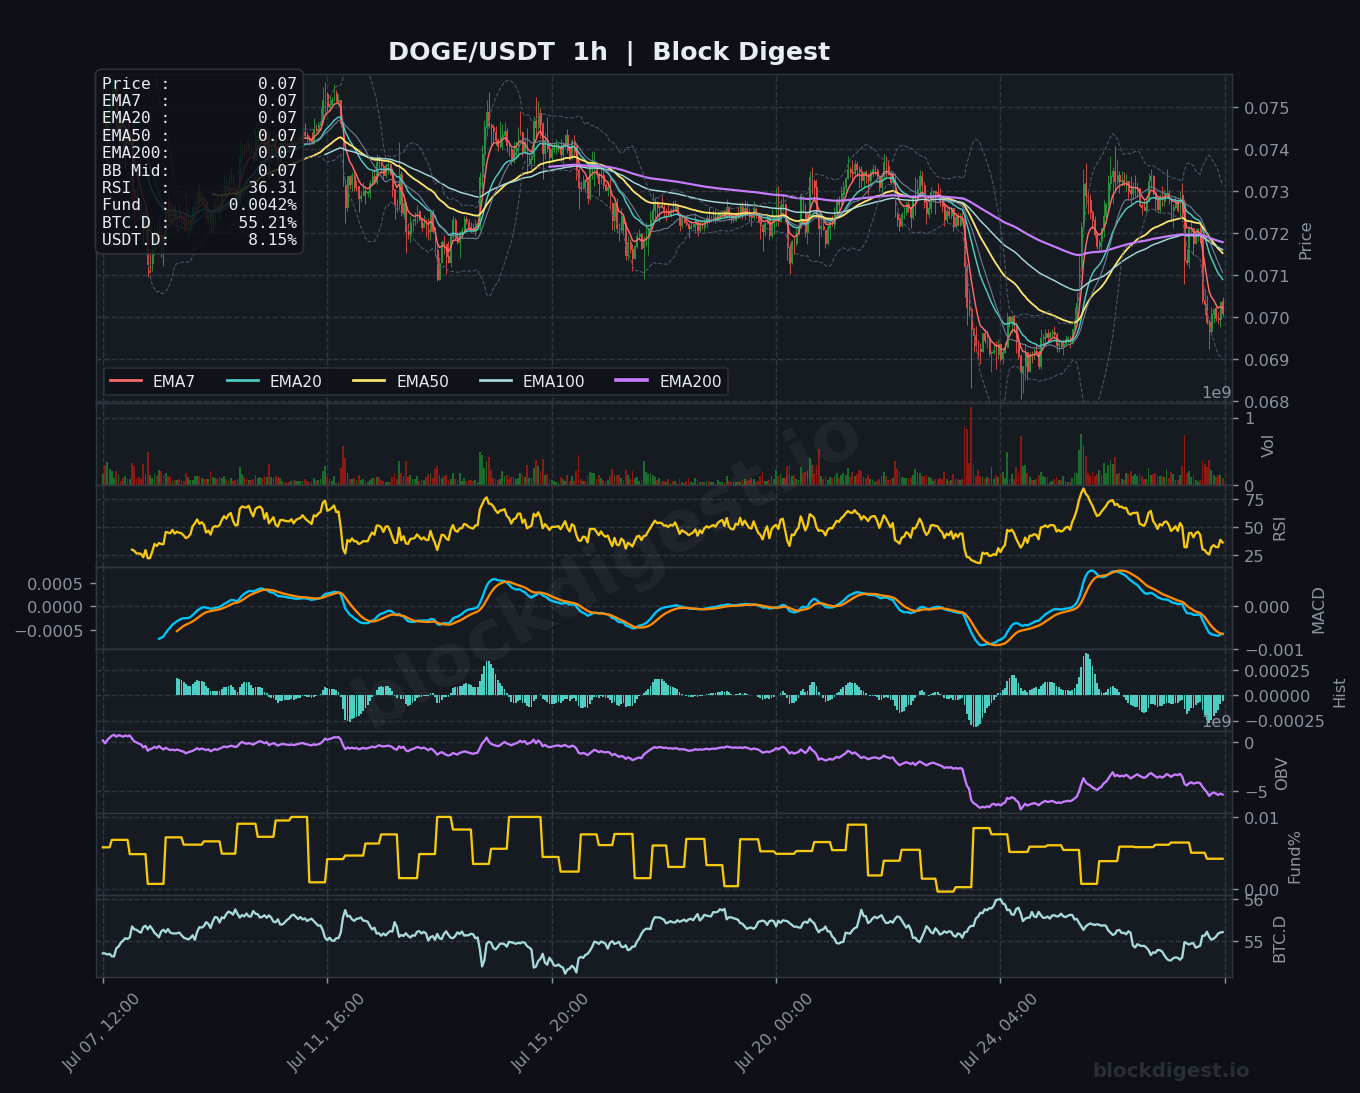
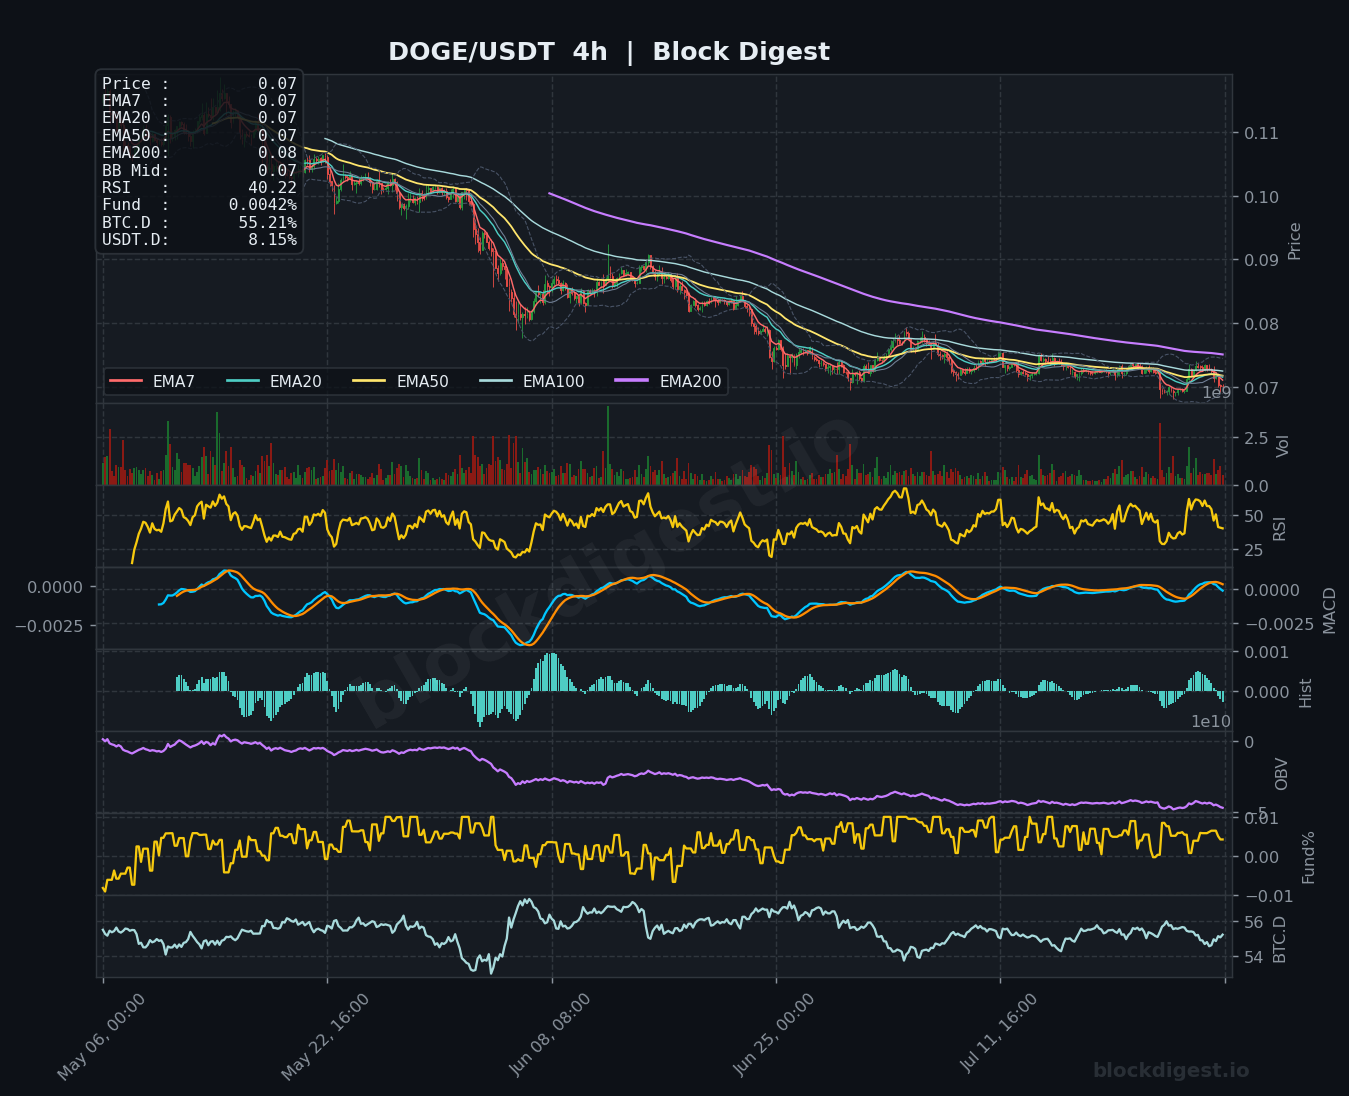
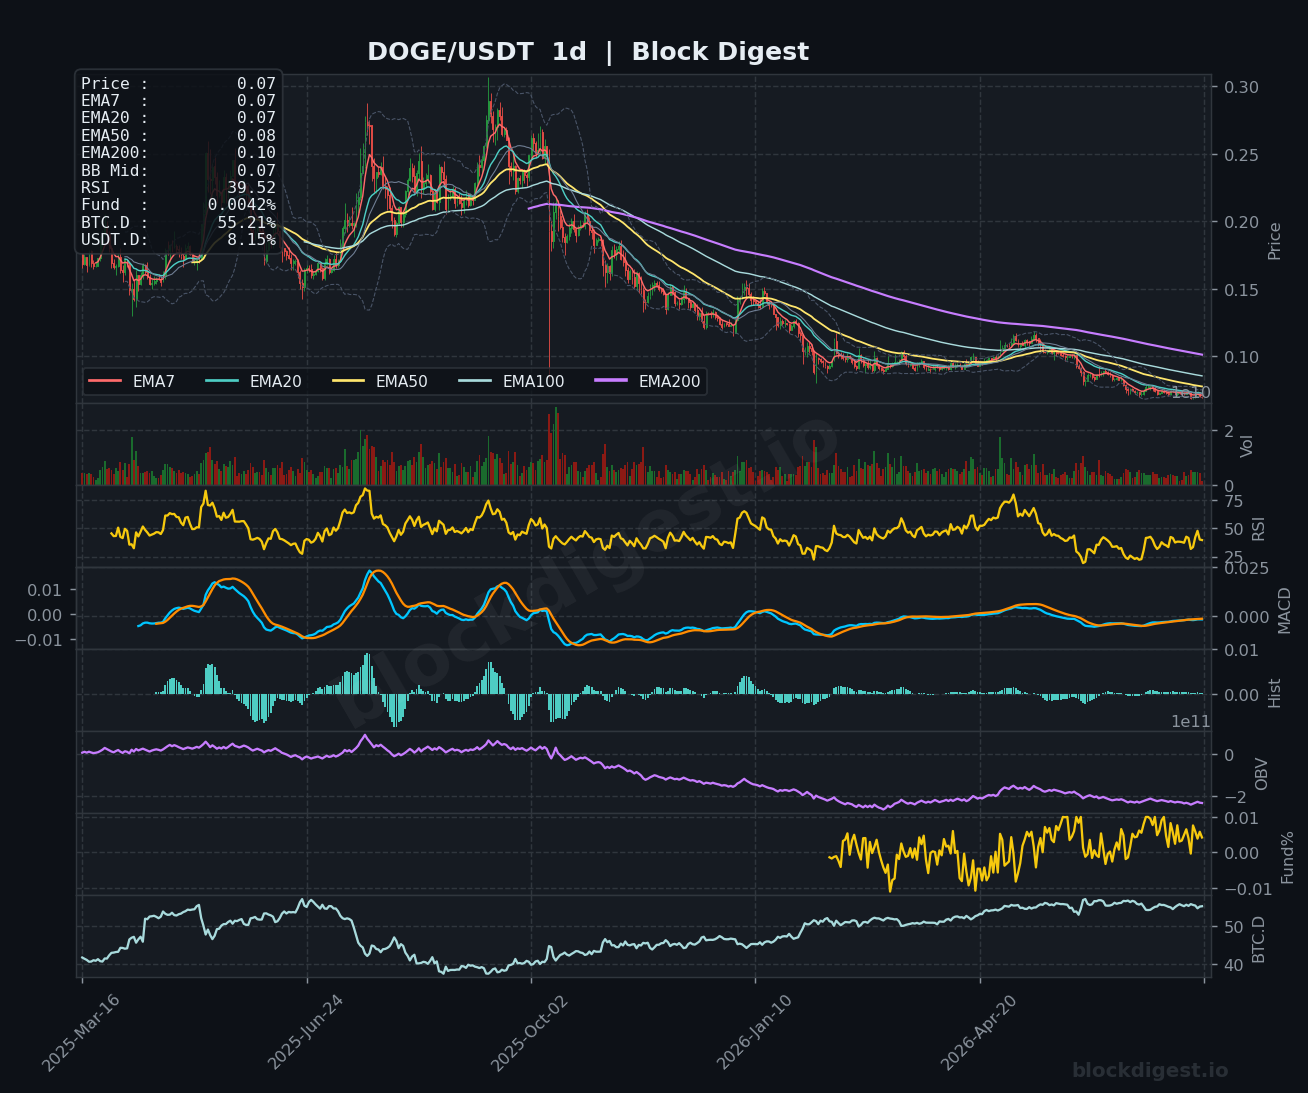
DOGE is trading at $0.0700, with all EMAs on the 1h chart converging tightly at the same level — a sign of extreme compression that typically precedes a directional move, though the RSI at 36.31 and a negatively sloping MACD lean toward the downside resolution being more probable. The 4h chart reinforces this caution, with RSI at 40.22 and an OBV that has been in a persistent downtrend since the most recent local peak, reflecting ongoing net selling despite the tight price range. On the daily chart, RSI at 39.52 and price sitting beneath the declining EMA50 ($0.08) and EMA200 ($0.10) confirm that DOGE remains in a macro downtrend with no structural reversal signals yet in place. Critical support is clustered at $0.069–$0.070; a close below this zone on elevated volume would be a significant bearish development, while a push above $0.073–$0.074 would be the first indication that short-term sellers are exhausted.
Litecoin (LTC)
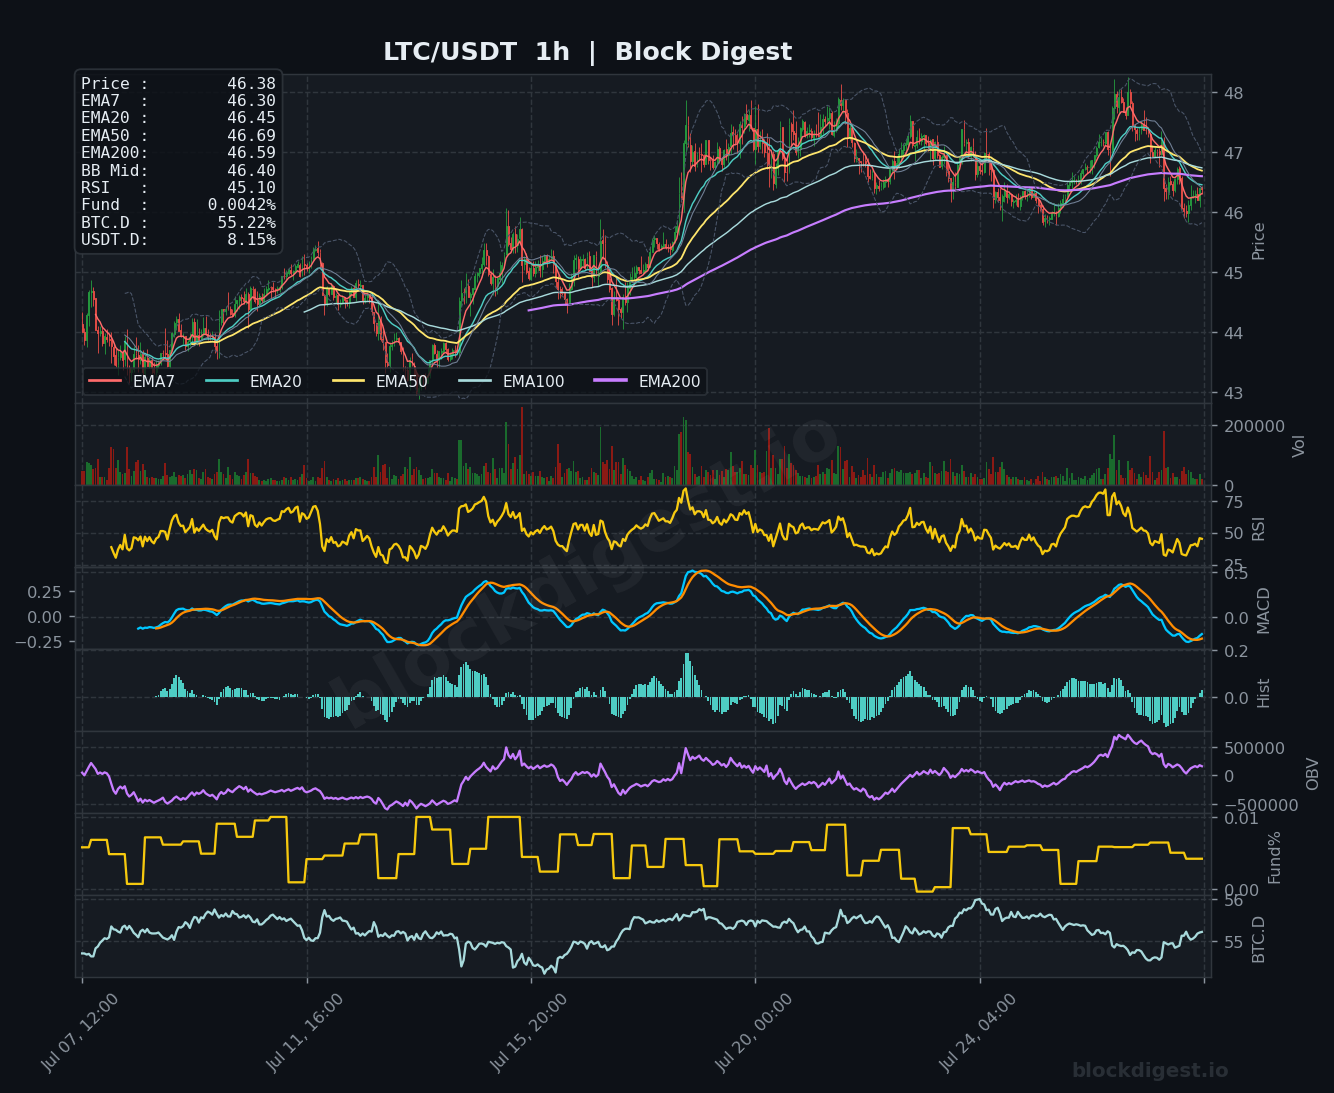
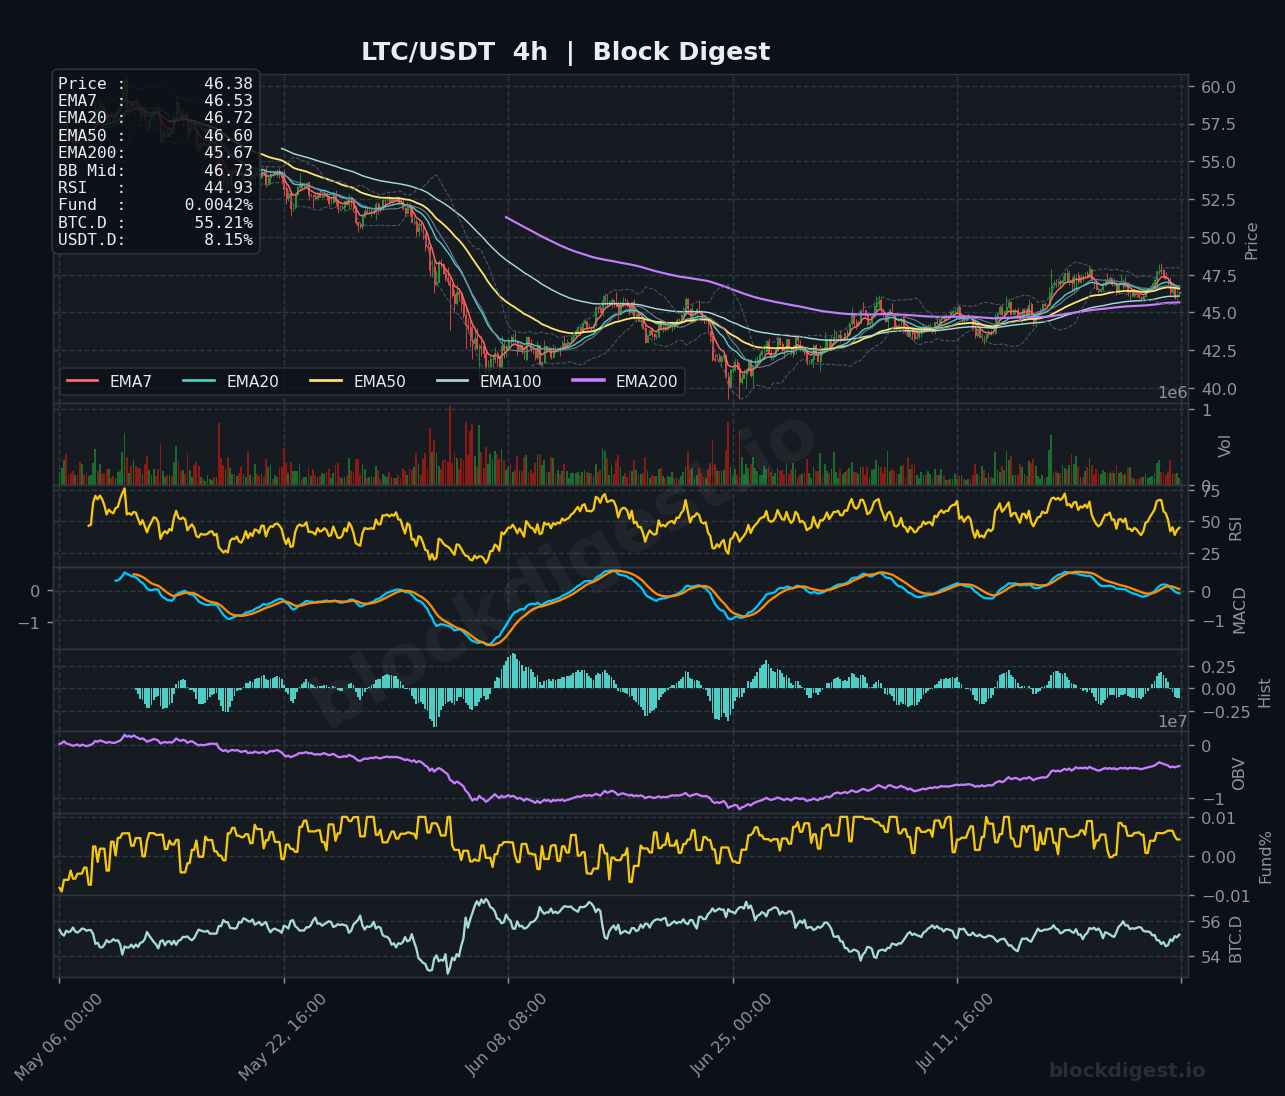
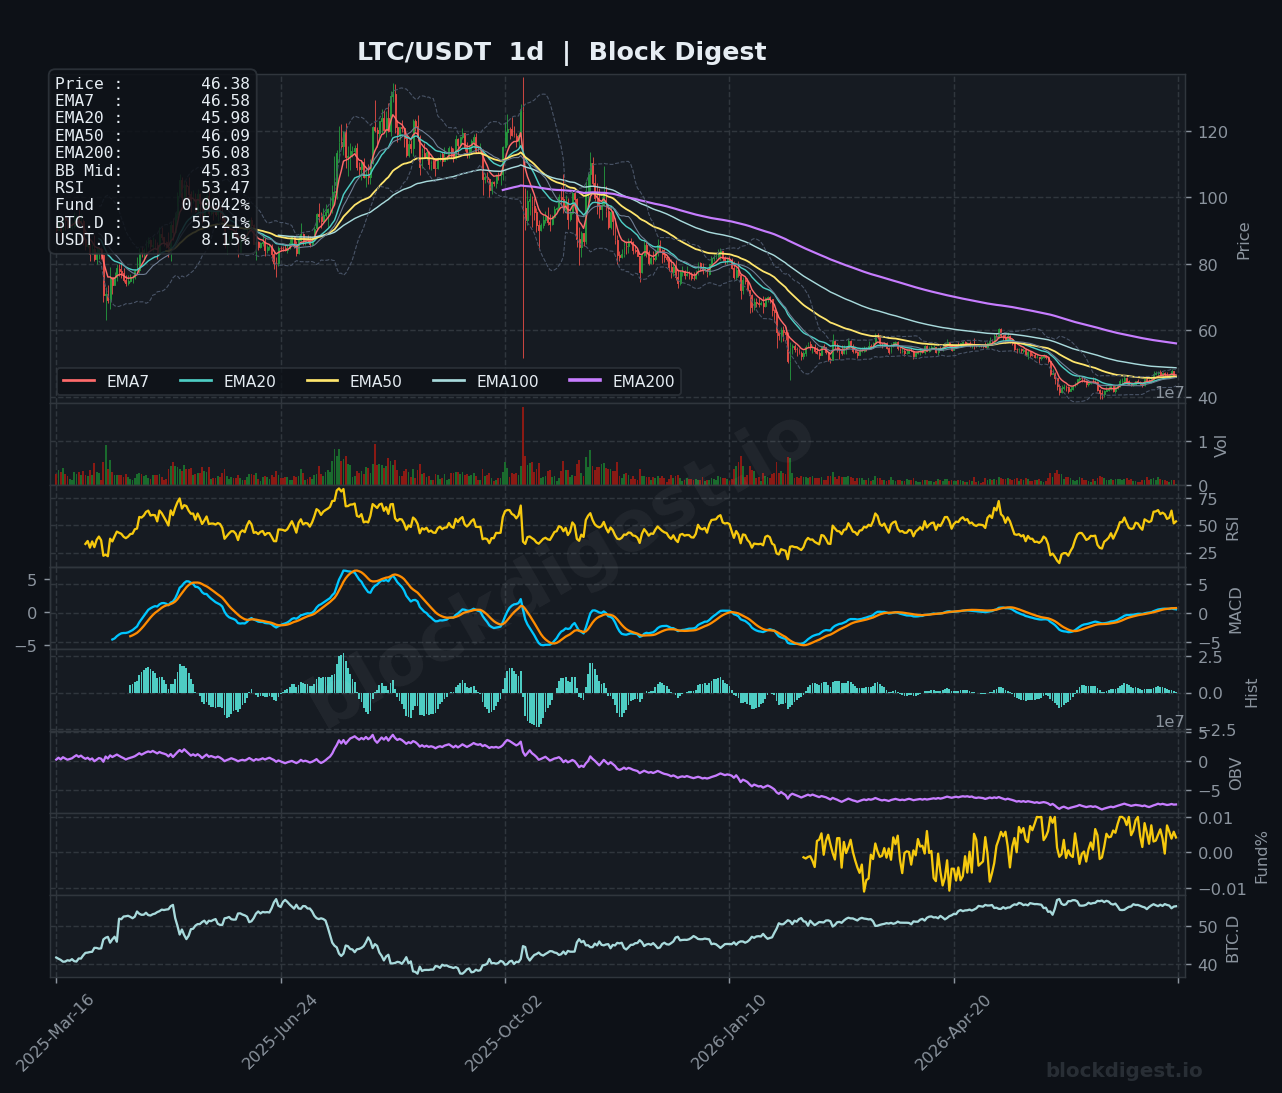
LTC stands out as one of the more constructive setups across today’s coverage, trading at $46.38 with a daily RSI at 53.47 — the only asset in this roundup showing a daily RSI above the 50 neutral line, a meaningful distinction from its peers. The 4h chart shows a recovering structure, with price building a base above the EMA200 at $45.67, and the MACD attempting to cross bullish after a prolonged compression phase. On the 1h timeframe, however, near-term selling has brought RSI down to 45.10 and the MACD histogram is turning red, suggesting a minor pullback within an otherwise improving trend; the $46.00–$46.40 zone is acting as a short-term battleground. Bulls want to defend $45.50–$46.00 on any dip and push above the $47.00–$48.00 resistance band to confirm the medium-term recovery thesis; a break back below $45.00 would undermine the broader constructive setup.
TRON (TRX)
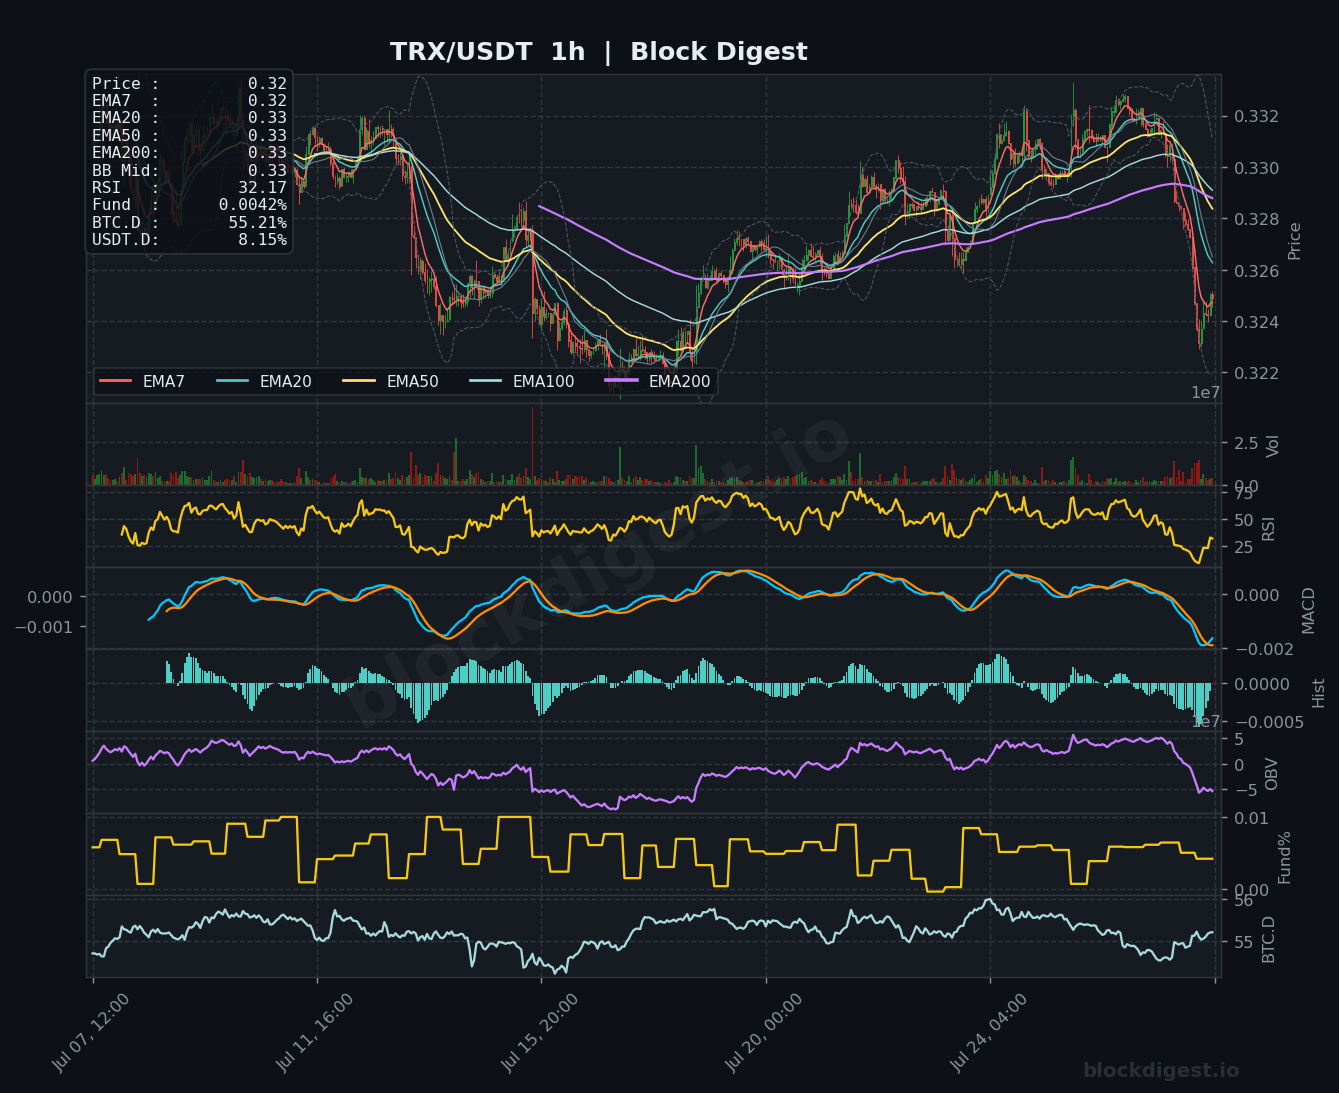
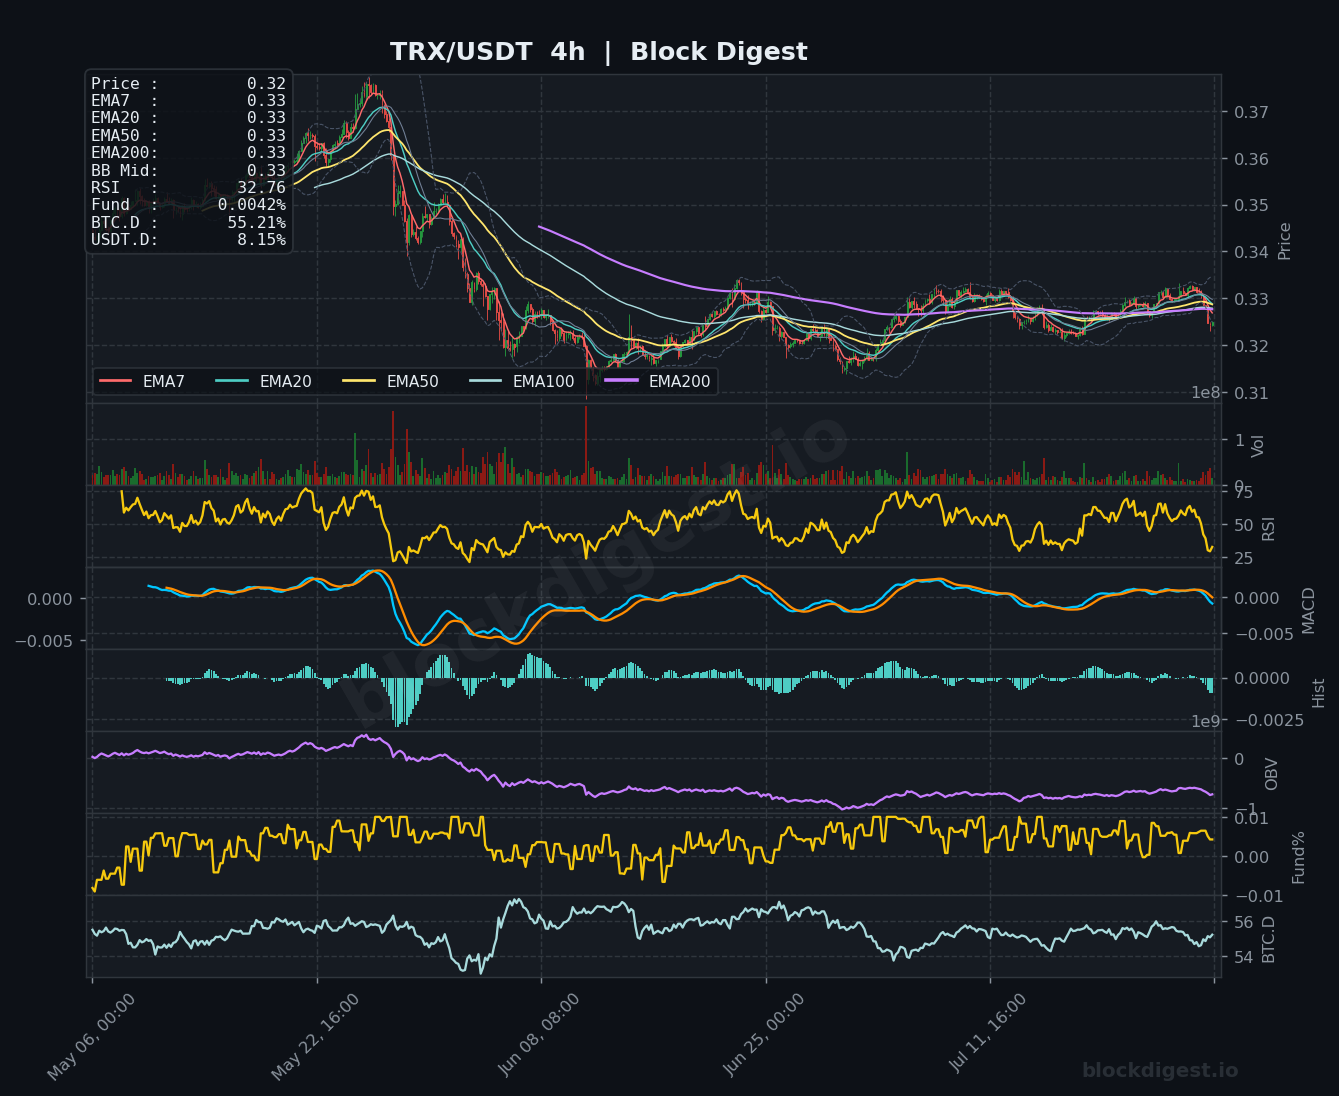
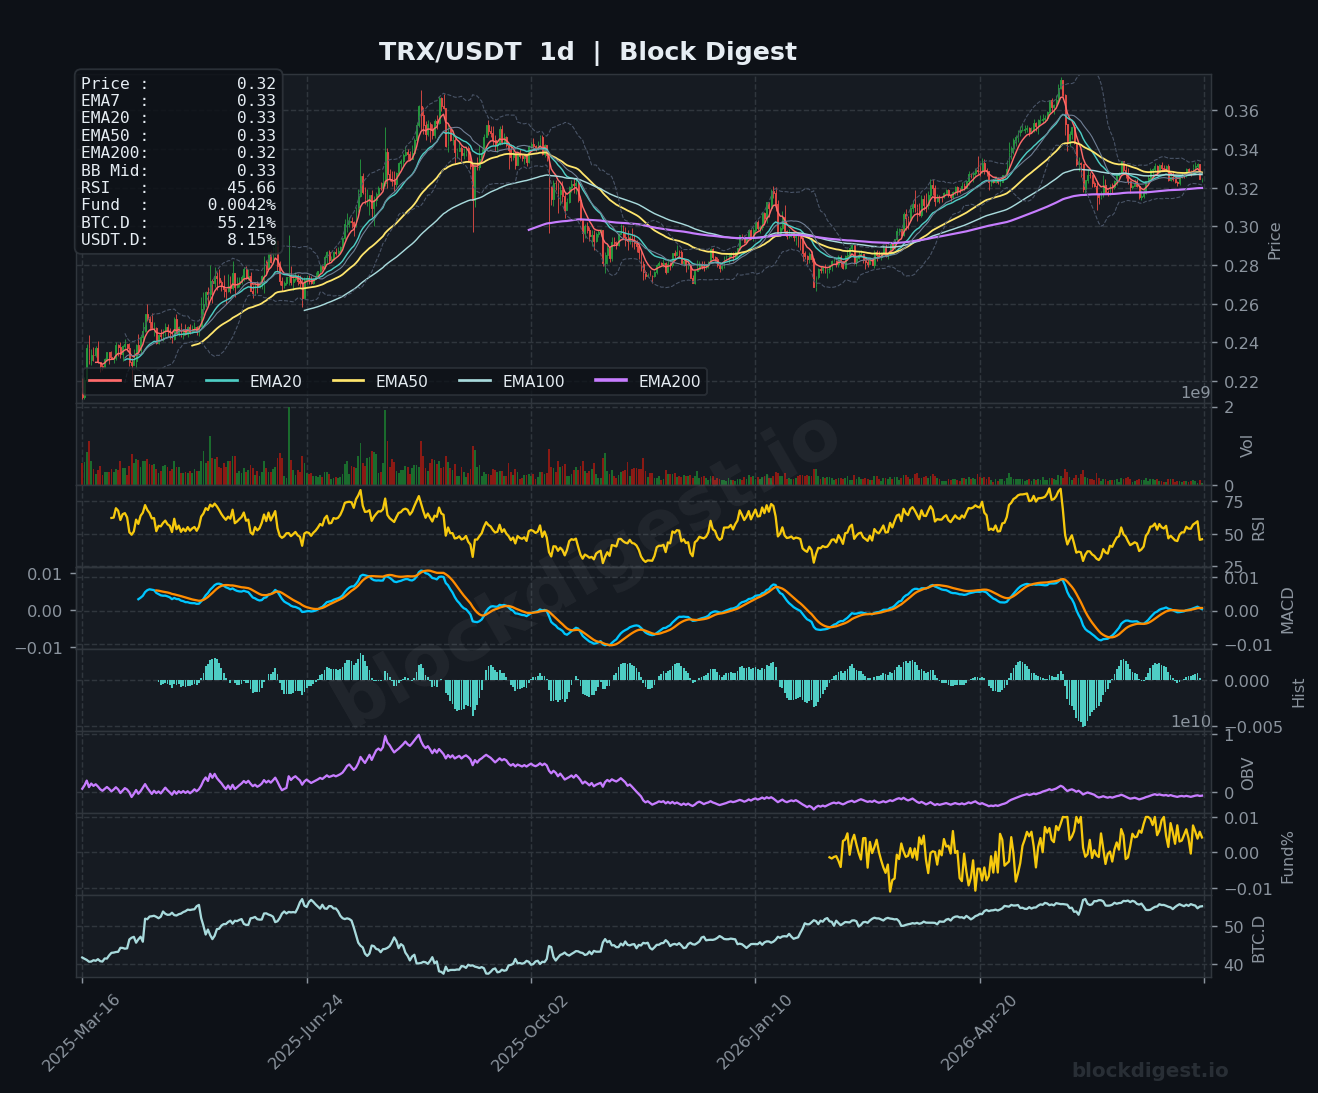
TRX is trading at $0.32, having rolled over sharply from a recent high near $0.332–$0.333, with the 1h RSI collapsing to 32.17 and the MACD diverging deeply negative — indicating fresh sell-side momentum rather than simple consolidation. The 4h chart shows RSI at 32.76 and an OBV that has been gradually drifting lower, confirming that the recent bounce toward the $0.33 area failed to attract meaningful buying conviction on higher timeframes. On the daily chart, TRX presents a more nuanced picture — the EMA200 at $0.32 is essentially at current price, offering a degree of structural support, and the daily RSI at 45.66 is not yet in distress territory, leaving room for a stabilization. The $0.320–$0.322 zone is the key short-term pivot; a hold here keeps the medium-term range intact, while a confirmed break below $0.318 opens the door toward $0.312–$0.315.
Altcoin Outlook
The overall altcoin picture as of July 28 is one of broad-based weakness and consolidation, with the majority of assets sitting beneath key EMAs and generating oversold readings on shorter timeframes without yet triggering meaningful recoveries — a combination that suggests exhaustion rather than a credible reversal. LTC is the relative standout, displaying the most constructive daily structure and the only RSI above 50 on the day timeframe, making it worth watching for a potential leadership role if broader risk appetite improves. XRP and SOL carry the heaviest short-term selling pressure based on RSI and MACD readings, while BNB and DOGE remain in structural downtrends with no clear catalysts for a trend reversal visible on-chain or on-chart. Traders should monitor BTC dominance closely — any pullback from the current 55.21% level would be an early signal that capital rotation into alts is beginning, a condition that would need to be confirmed before adopting a more constructive stance across this group.
—
Disclaimer: This analysis is for informational purposes only and does not constitute financial advice. Cryptocurrency markets are highly volatile and unpredictable. All trading decisions should be made based on your own research and risk tolerance. Block Digest is not responsible for any financial losses incurred as a result of acting on this content.