BTC Daily Analysis — May 04, 2026
BTC Daily Analysis – May 04, 2026
Market Overview
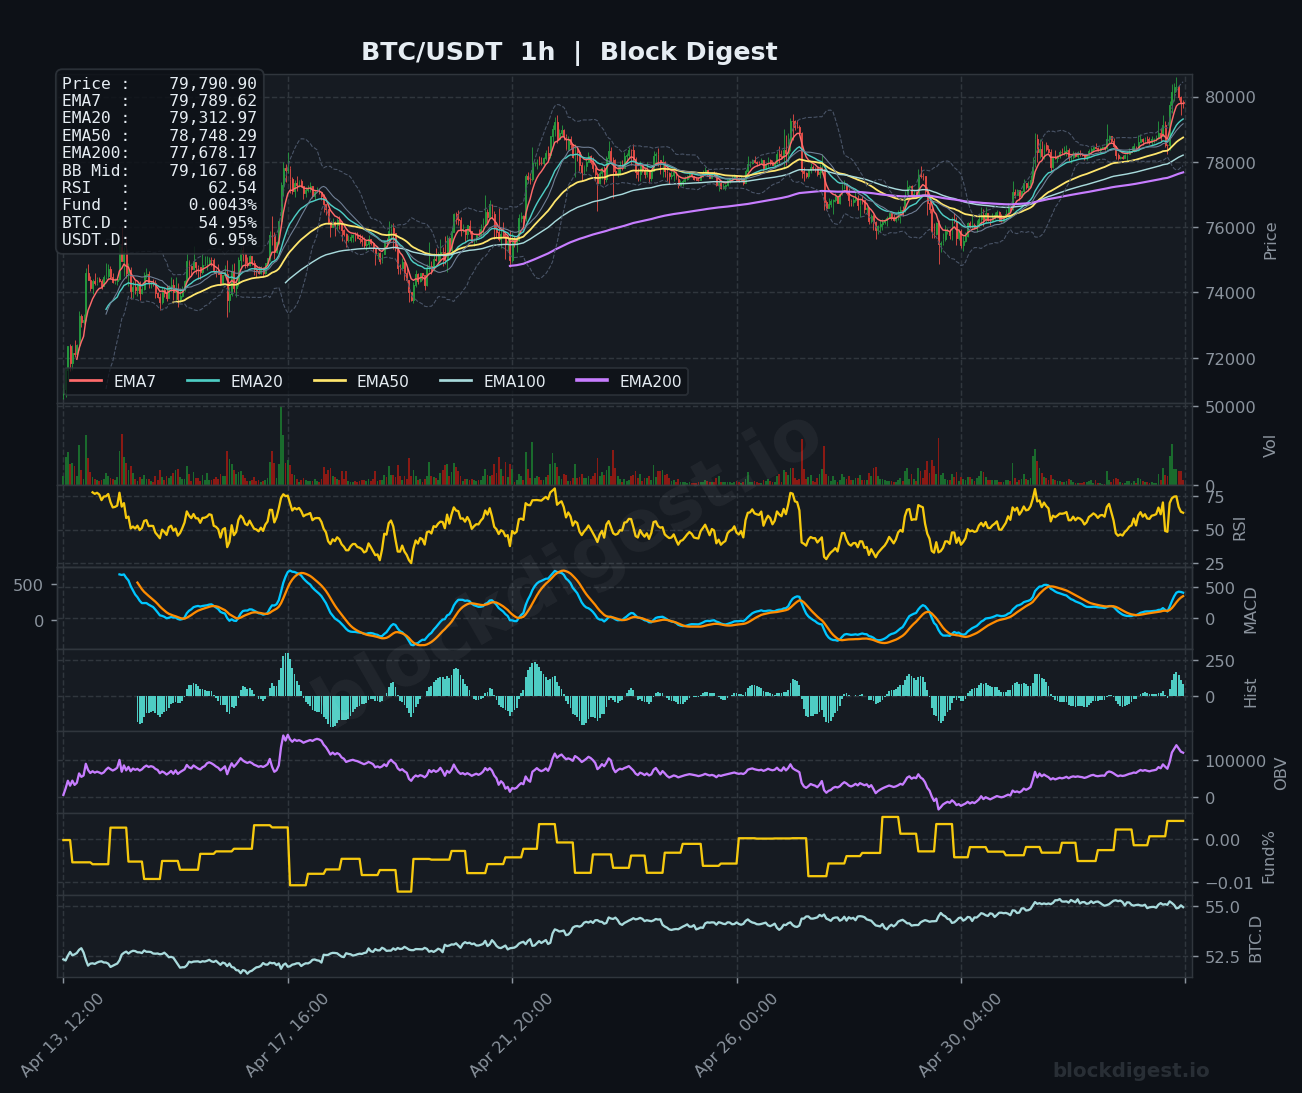
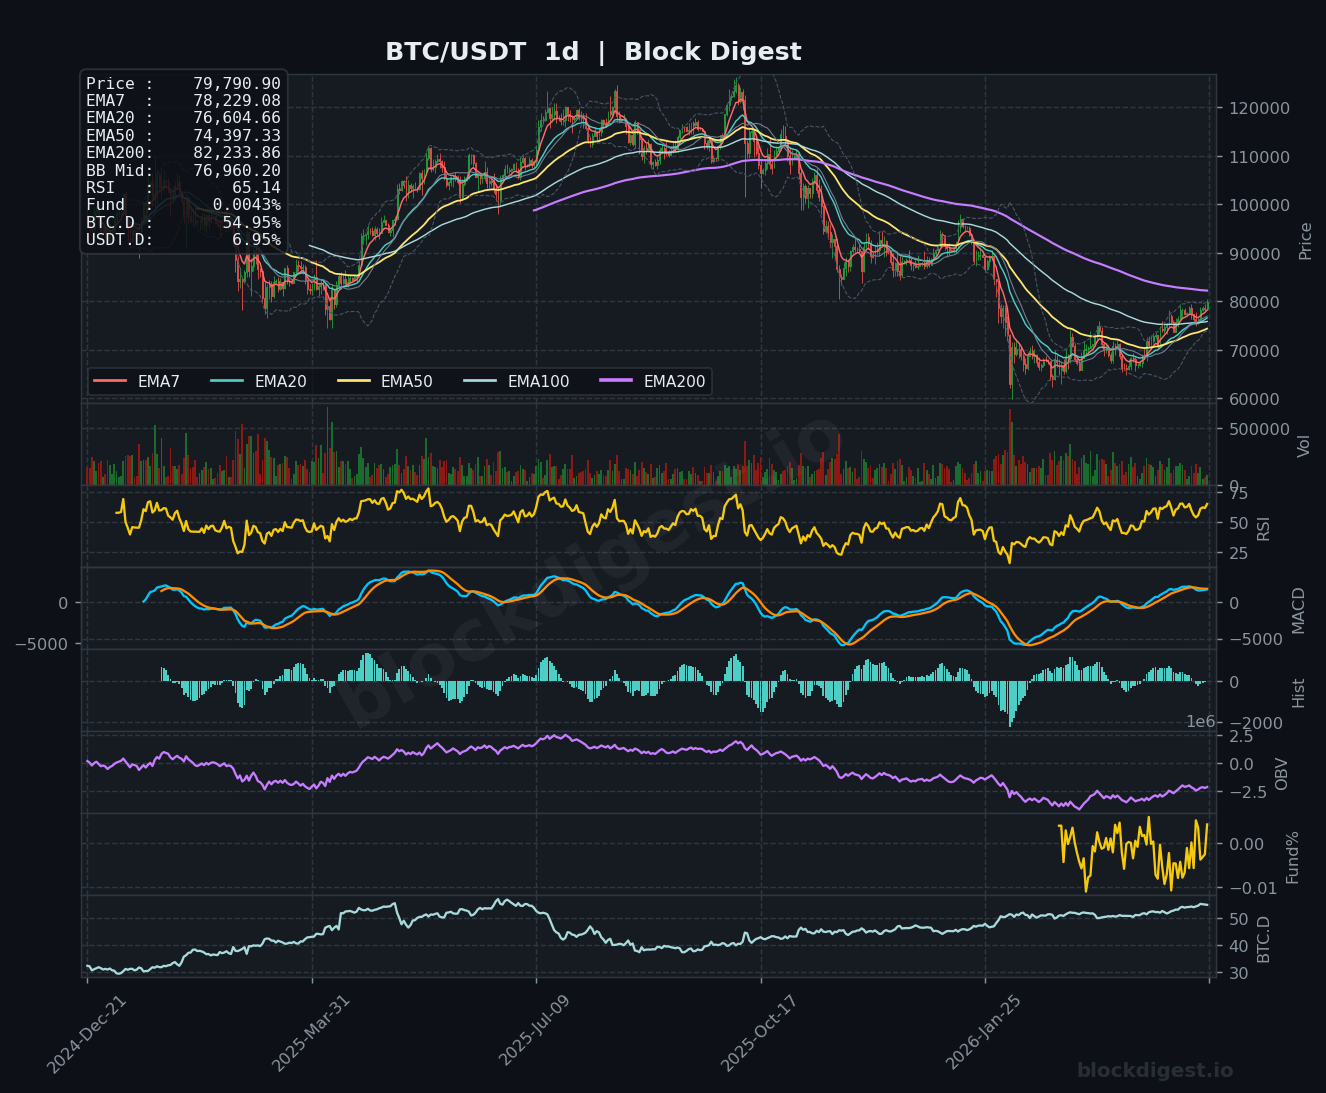
Bitcoin is currently trading at $79,790.90, executing a sharp breakout above its entire EMA structure across multiple timeframes. Price is positioned above all key exponential moving averages on the 1-hour chart (EMA7: $79,789.62, EMA20: $79,312.07, EMA50: $78,748.29, EMA200: $77,678.17) and has decisively pierced the upper Bollinger Band at $79,167.68, signaling an intensifying momentum shift. On the daily timeframe, price has begun reclaiming the EMA7 ($78,229.08) after an extended consolidation phase, though it remains below the EMA50 ($74,397.33) and significantly beneath the declining EMA200 ($82,233.86), indicating the broader trend structure is still in recovery mode following previous downside pressure.
Multi-Timeframe Confluence
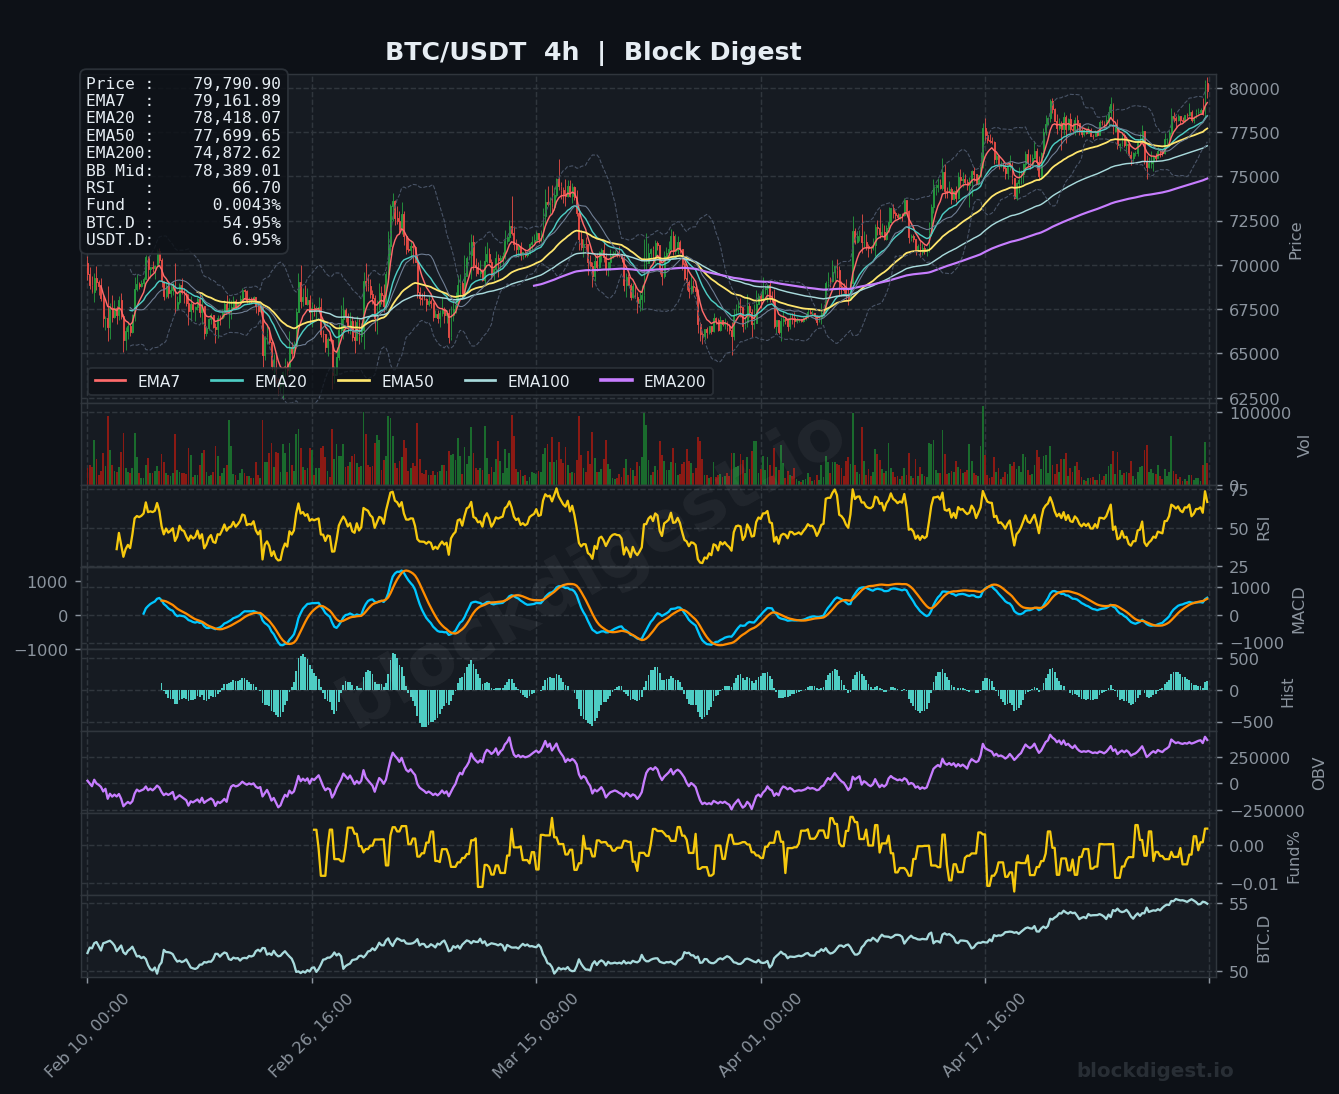
All three analyzed timeframes are exhibiting bullish alignment for the first time in the recent cycle, with the 1-hour chart leading an aggressive upward impulse that’s now being validated by the 4-hour structure. The 4-hour timeframe shows price trading above all short-term EMAs (EMA7: $79,161.89, EMA20: $78,418.07, EMA50: $77,699.65) with the EMA7/EMA20 bullish crossover confirmed, providing intermediate-term validation for the move. Critical confluence exists at the $78,400-$78,750 zone where the 1-hour EMA50, 4-hour EMA20, and daily EMA7 converge, now serving as the primary support cluster. The daily chart’s bullish reclaim of the EMA7 suggests this isn’t merely intraday noise but rather a structural shift gaining higher timeframe confirmation, though the test will be sustaining momentum above the daily EMA20 ($76,604.66).
Key Levels to Watch
Resistance:
- $80,000-$80,200: Psychological resistance and approximate location of recent local highs; a clean break would likely trigger additional momentum-based buying
- $82,234: Daily EMA200, representing the major structural resistance and trend definition level where substantial supply likely resides
- $84,000-$85,000: Volume profile resistance zone visible on the daily chart from previous consolidation areas
Support:
- $78,400-$78,750: Primary support confluence zone (1h EMA50, 4h EMA20, 1d EMA7) that must hold to maintain bullish structure
- $77,680-$77,700: 1-hour EMA200 and 4-hour EMA50 convergence, representing secondary support and the line between continuation and correction
- $76,600: Daily EMA20, critical structural support that would indicate failure of the breakout attempt if retested
Momentum & On-Chain Signals
RSI readings across timeframes reveal elevated but not yet extreme conditions: 1-hour RSI at 62.54 shows room for extension before overbought territory, while the 4-hour RSI at 66.70 approaches but hasn’t breached the 70 threshold, and the daily RSI at 65.14 confirms strengthening momentum without exhaustion signals. The MACD on both 1-hour and 4-hour charts displays strong bullish crossovers with expanding positive histograms, indicating accelerating momentum, while the daily MACD is attempting to curl bullish from negative territory. OBV shows consistent accumulation across all timeframes with notable volume spikes accompanying the recent breakout, suggesting institutional participation rather than retail-driven volatility. Funding rates at 0.0043% remain neutral to slightly positive, indicating long positions are willing to pay but without excessive leverage-induced euphoria that typically marks local tops.
BTC Dominance & Market Sentiment
Bitcoin Dominance currently sits at 54.95%, showing a modest uptick that suggests capital rotation into BTC as a risk-on leader rather than defensive positioning. This dominance level, combined with USDT Dominance at 6.95% (trending lower), indicates constructive risk appetite across the broader crypto market with stablecoin capital deploying into risk assets. The combination of rising BTC price with stable-to-rising dominance typically precedes broader altcoin rallies, suggesting this BTC move could be the precursor to wider market participation. The relatively moderate dominance reading (not exceeding 60%) implies this isn’t a flight-to-safety scenario but rather genuine demand-driven accumulation.
Risk Scenarios
Bullish case: A sustained 4-hour close above $80,000 with RSI maintaining above 60 would confirm breakout validity and likely trigger momentum toward the $82,234 daily EMA200 resistance, with extension potential toward $84,000-$85,000 if volume remains elevated and the $78,400-$78,750 support cluster holds on any retest.
Bearish case: Failure to hold the $78,400-$78,750 confluence zone on a 4-hour closing basis would signal false breakout dynamics and likely trigger stop-loss cascades toward the $77,680 level, with a break below potentially accelerating downside to retest the $76,600 daily EMA20 and potentially the $74,400 daily EMA50.
Outlook
Bitcoin’s technical structure presents a compelling bullish setup with multi-timeframe confirmation emerging, though the market remains at a critical juncture requiring follow-through above $80,000 to validate the breakout thesis. The next 24-48 hours will be decisive—watch for either sustained momentum above psychological resistance with the $78,400-$78,750 zone holding as support, or rejection from current levels signaling exhaustion. Key triggers include the daily candle close relative to $79,000, 4-hour RSI behavior near the 70 level, and whether OBV continues trending higher on any consolidation. The bias leans cautiously bullish given the technical alignment, but traders should respect the $78,400 support as the level that separates continuation from correction, with protective stops below $77,680 advised for leveraged positions.
Disclaimer: This analysis is for informational purposes only and does not constitute financial advice. Cryptocurrency markets are highly volatile and unpredictable. All trading decisions should be made based on your own research and risk tolerance. Block Digest is not responsible for any financial losses incurred as a result of acting on this content.
