Altcoin Daily Analysis: Extreme Fear at 22, Bitcoin Dominance Suppresses Alts
Market Context
The broader altcoin market is operating under significant pressure as of July 14, 2026, with the global crypto market cap sliding to approximately $2.23 trillion and the Fear & Greed Index deep in Extreme Fear territory at 22. Bitcoin dominance (BTC.D) sits at 55.15%, a persistently elevated reading that continues to suppress altcoin capital rotation, while USDT.D at 8.23% signals that a meaningful portion of capital remains parked on the sidelines. Geopolitical risk — particularly renewed U.S.-Iran tensions driving oil prices higher — has amplified the risk-off tone, leaving most altcoins struggling to find sustained bids.
Solana (SOL)
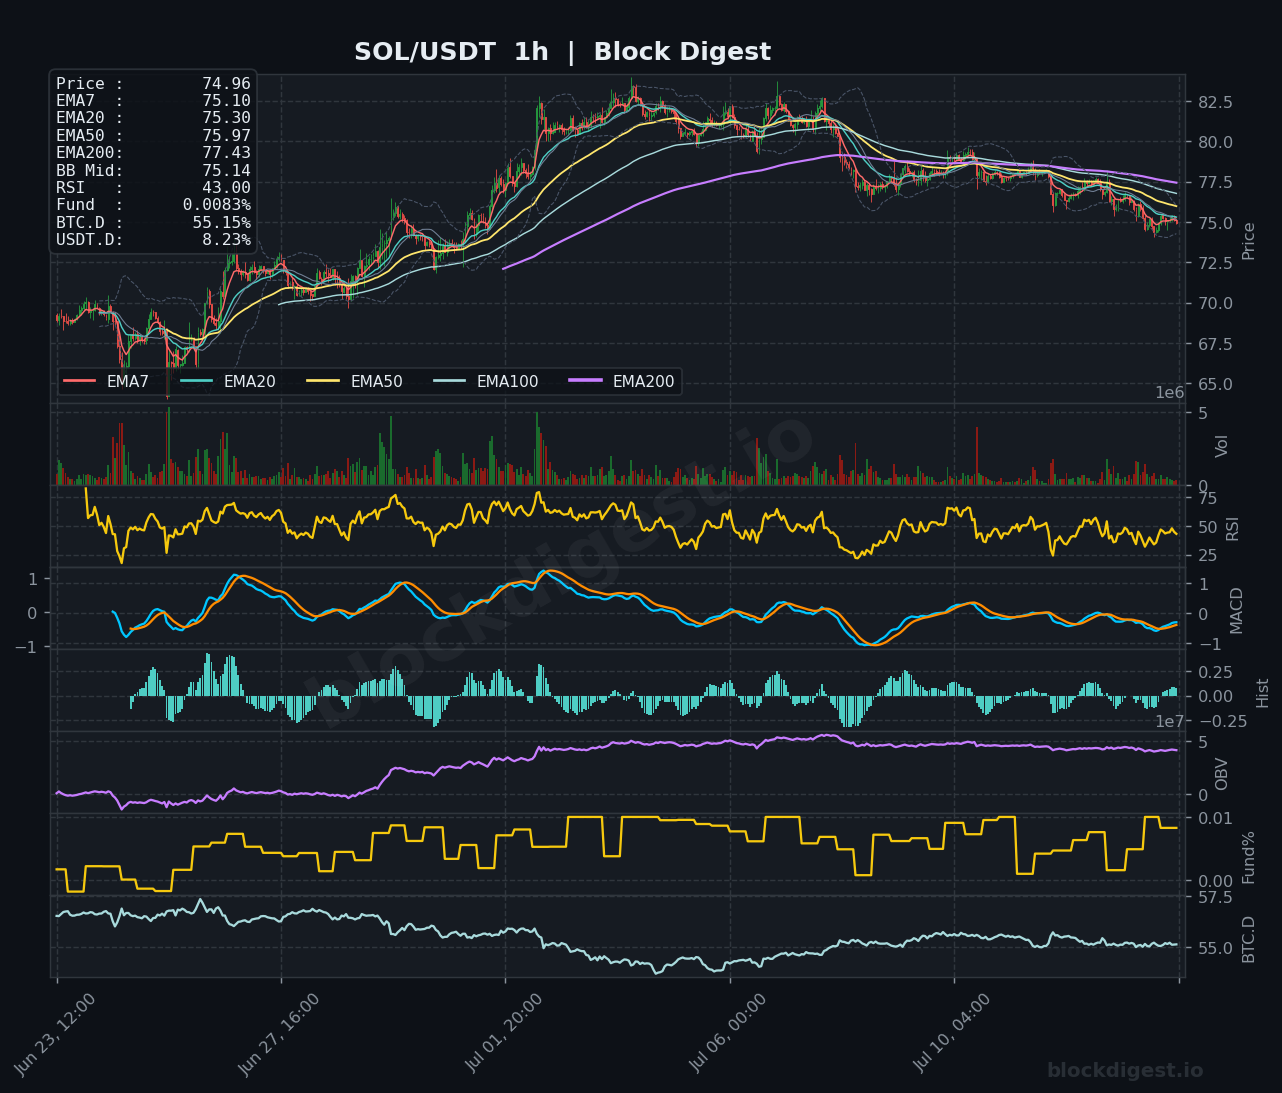
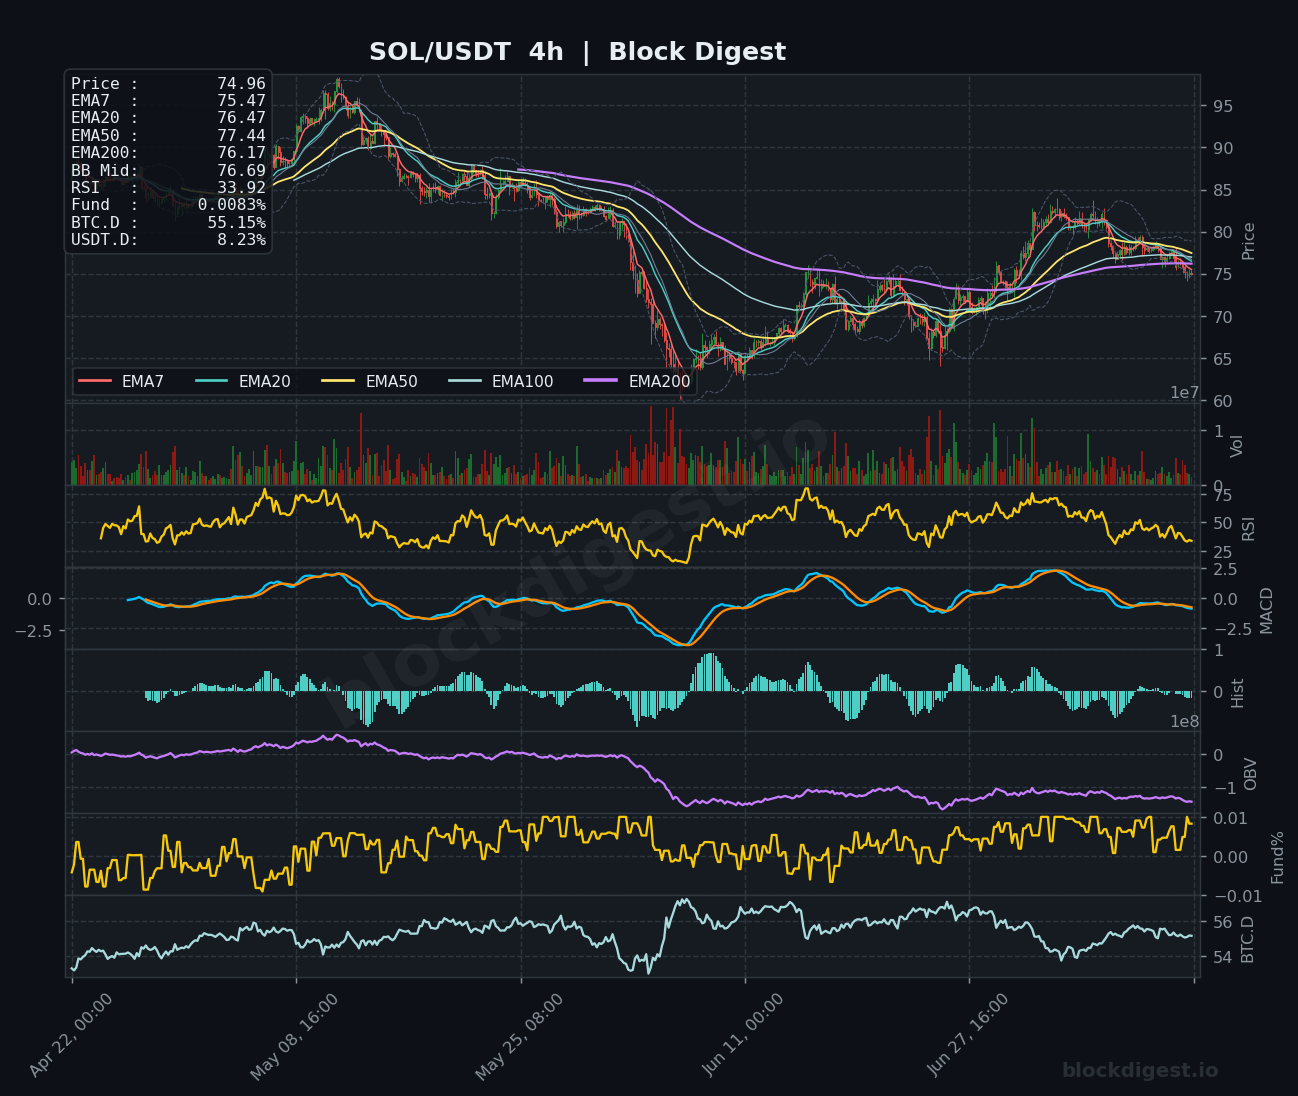
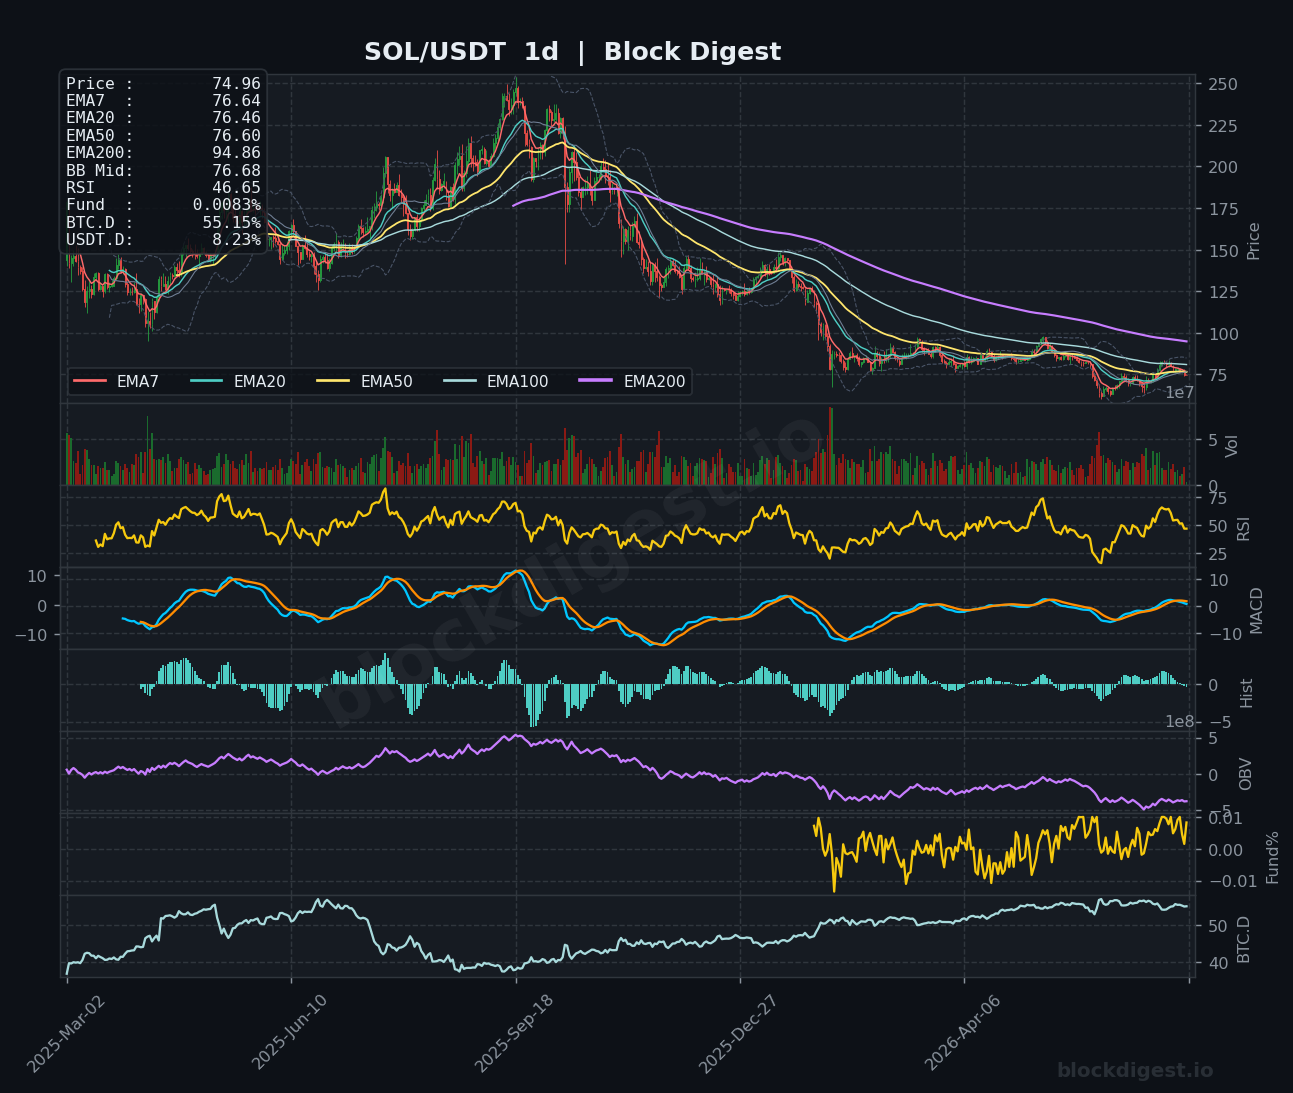
SOL is trading at $74.96, having failed to sustain a breakout above the key $80 resistance level and now sitting below all major EMAs on the 4h chart (EMA7 at $75.47, EMA20 at $76.47, EMA50 at $77.44), confirming a bearish structure across the intermediate timeframe. On the 1h chart, RSI has slipped to 43, with MACD hovering near the zero line and histogram bars turning marginally negative, suggesting fading bullish momentum. The daily chart paints a grimmer longer-term picture: price remains well below the EMA200 at $94.86, and OBV has trended downward since the peak, indicating sustained distribution pressure. Immediate support sits around $72–$73; bulls need a decisive reclaim of $77.50 (EMA20/50 cluster on the 4h) to shift short-term bias back to neutral.
XRP (XRP)
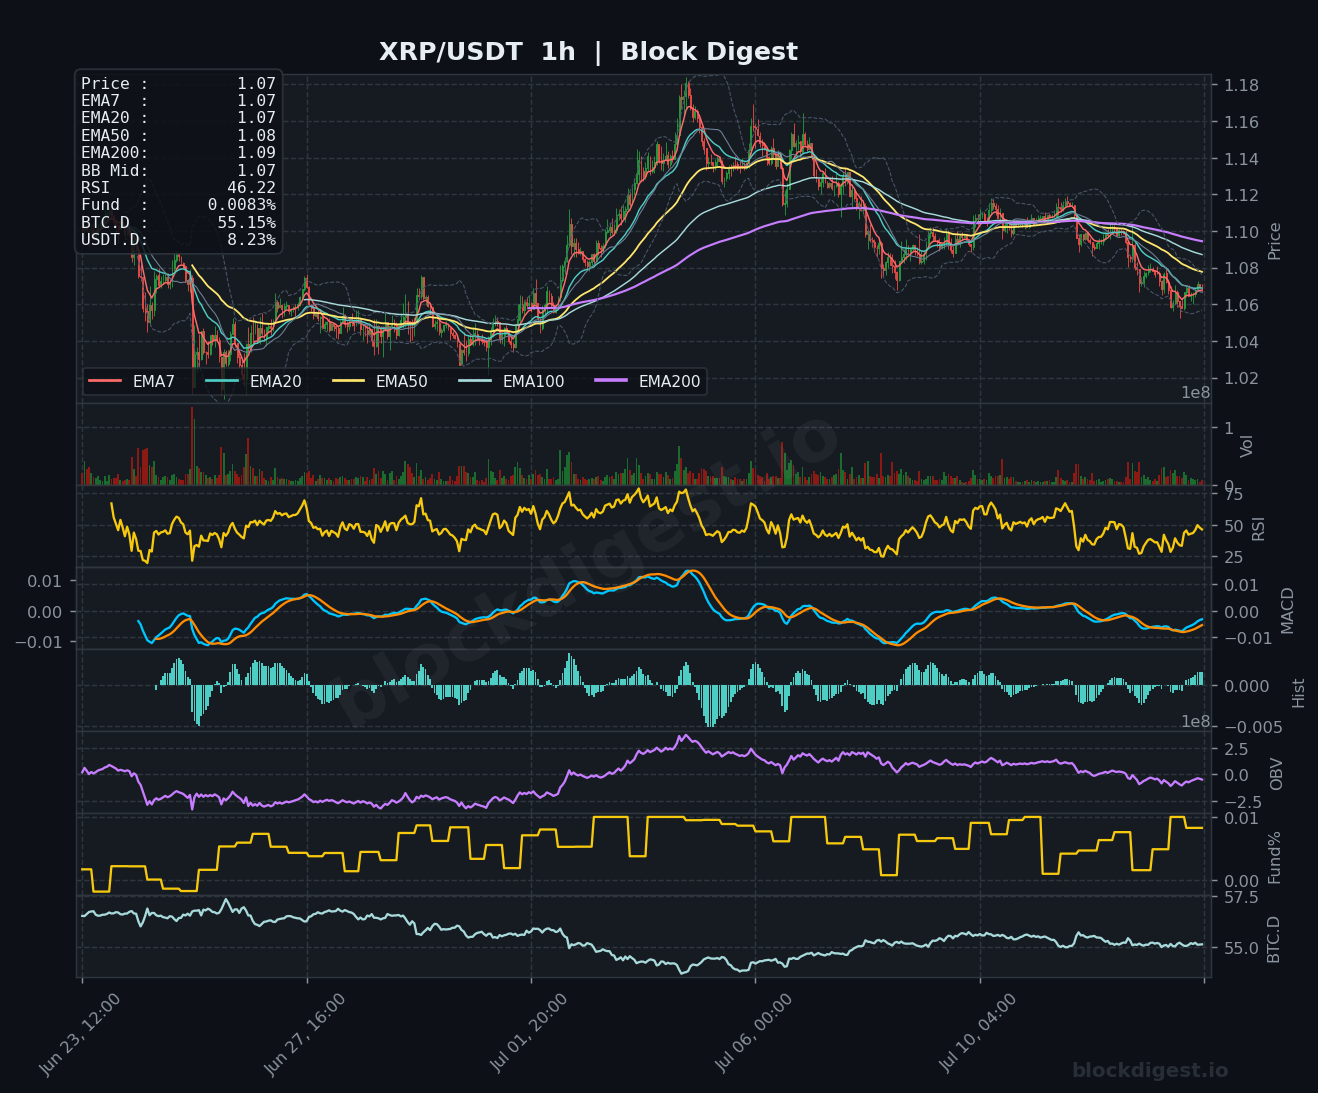
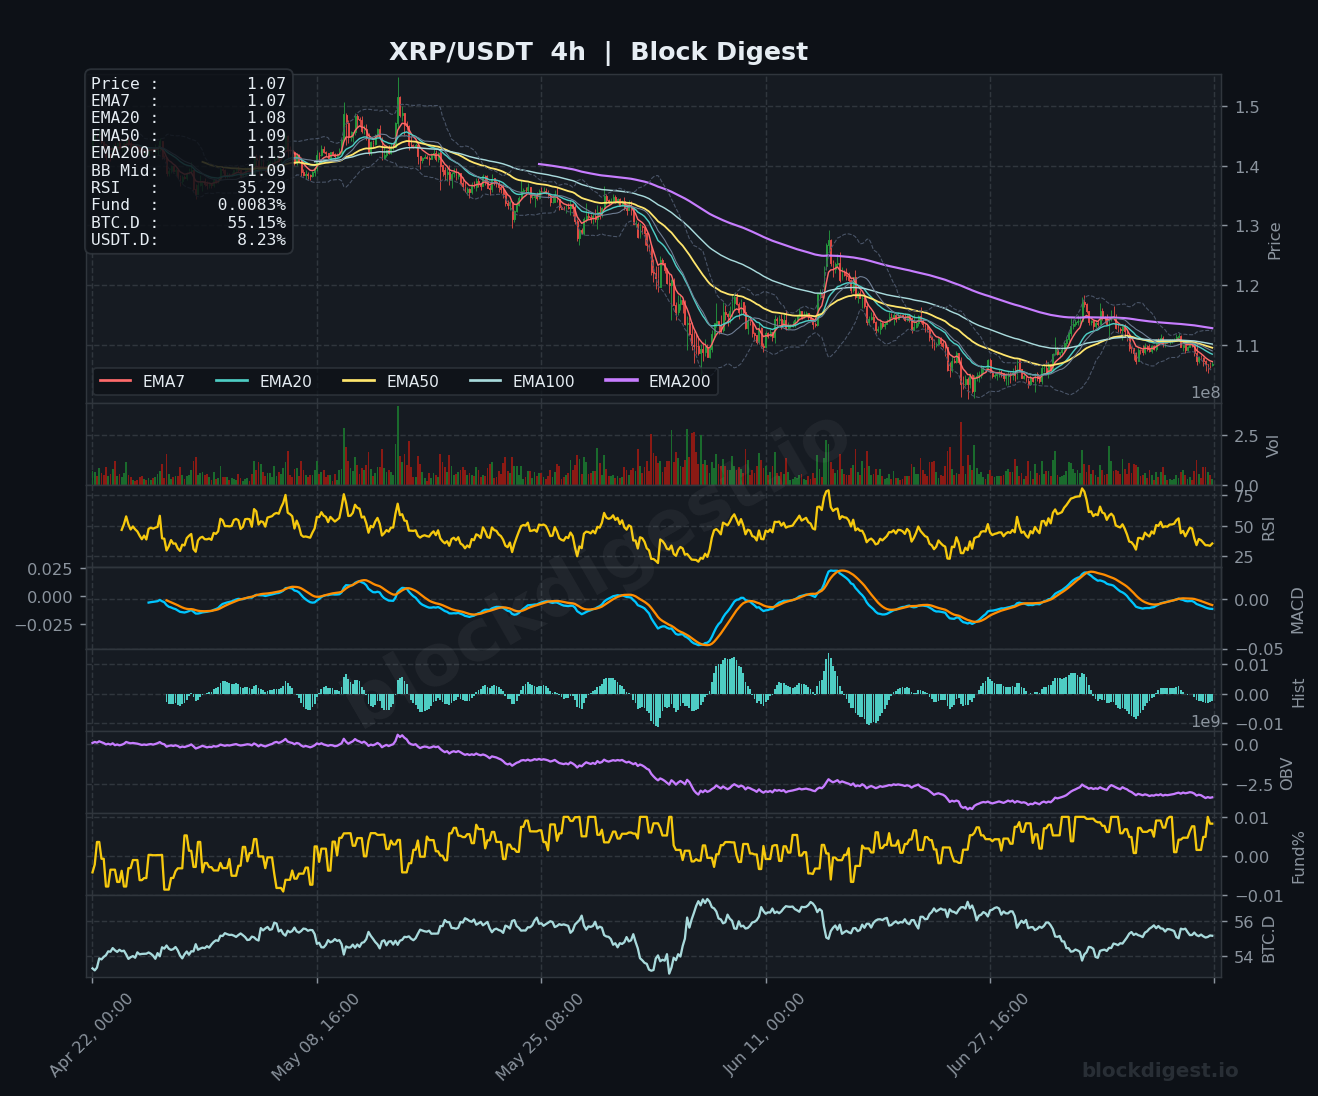
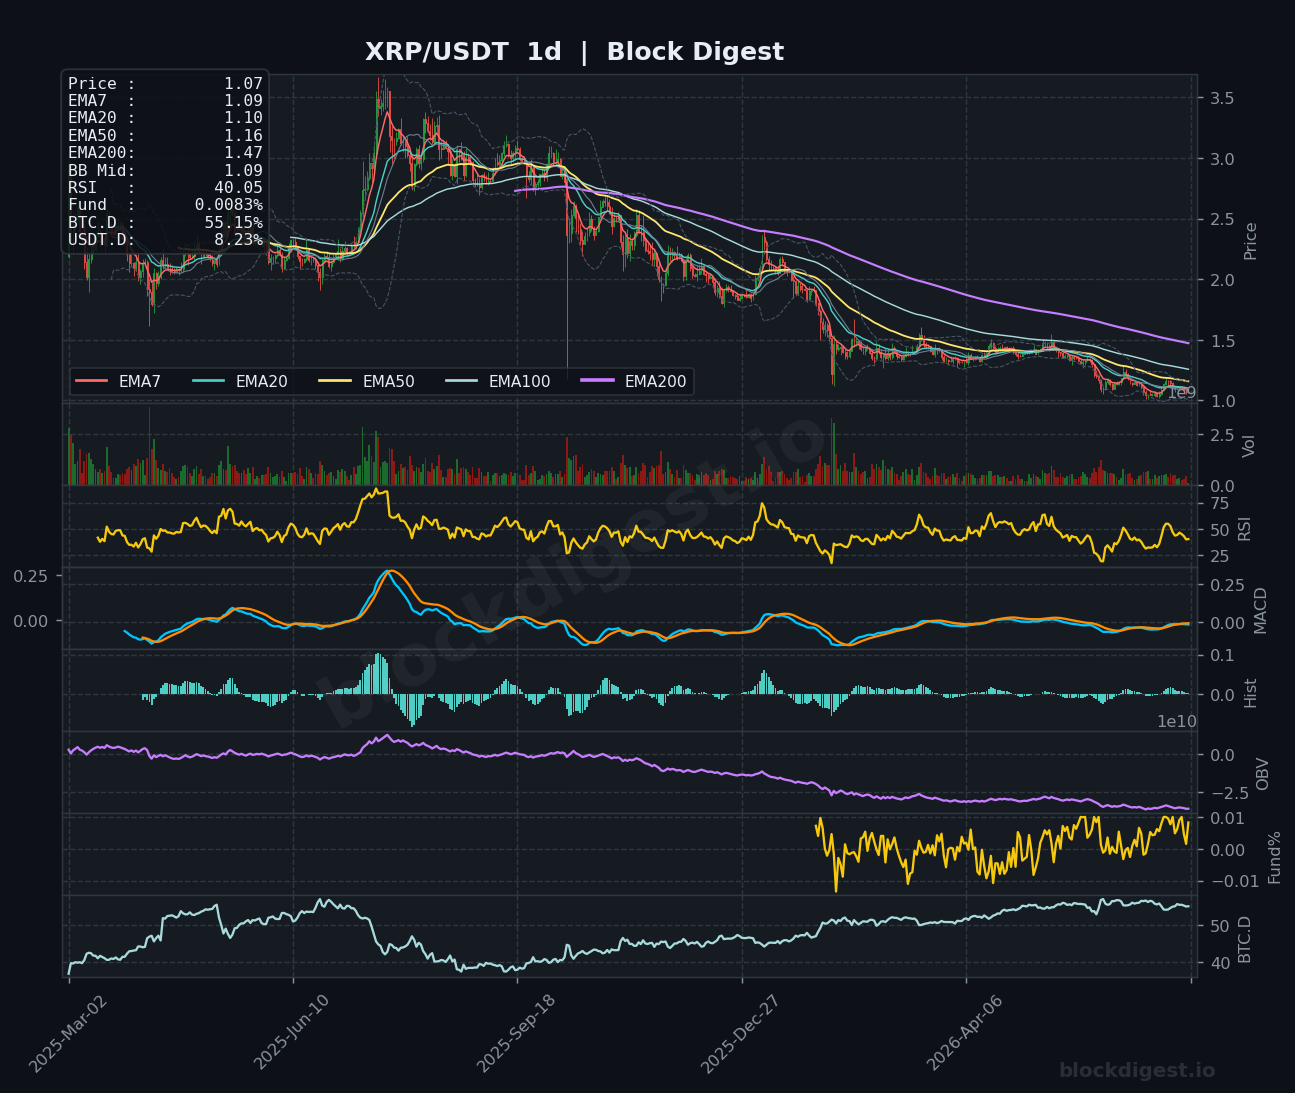
XRP is trading at $1.07, consolidating near a critical psychological support level after a pronounced decline from the $1.18 highs seen earlier this month. The 4h chart shows price firmly below all key EMAs — EMA7 at $1.07, EMA20 at $1.08, EMA50 at $1.09 — with RSI depressed at 35.29 and MACD still in negative territory, pointing to continued near-term weakness. On the daily timeframe, RSI sits at 40.05 and the EMA200 at $1.47 acts as a distant overhead ceiling, underscoring the extent of the longer-term downtrend. OBV on both the 4h and daily charts continues to trend lower, confirming that selling volume outweighs accumulation; a hold of $1.05 support is critical to avoiding a deeper flush toward $0.95.
BNB (BNB)
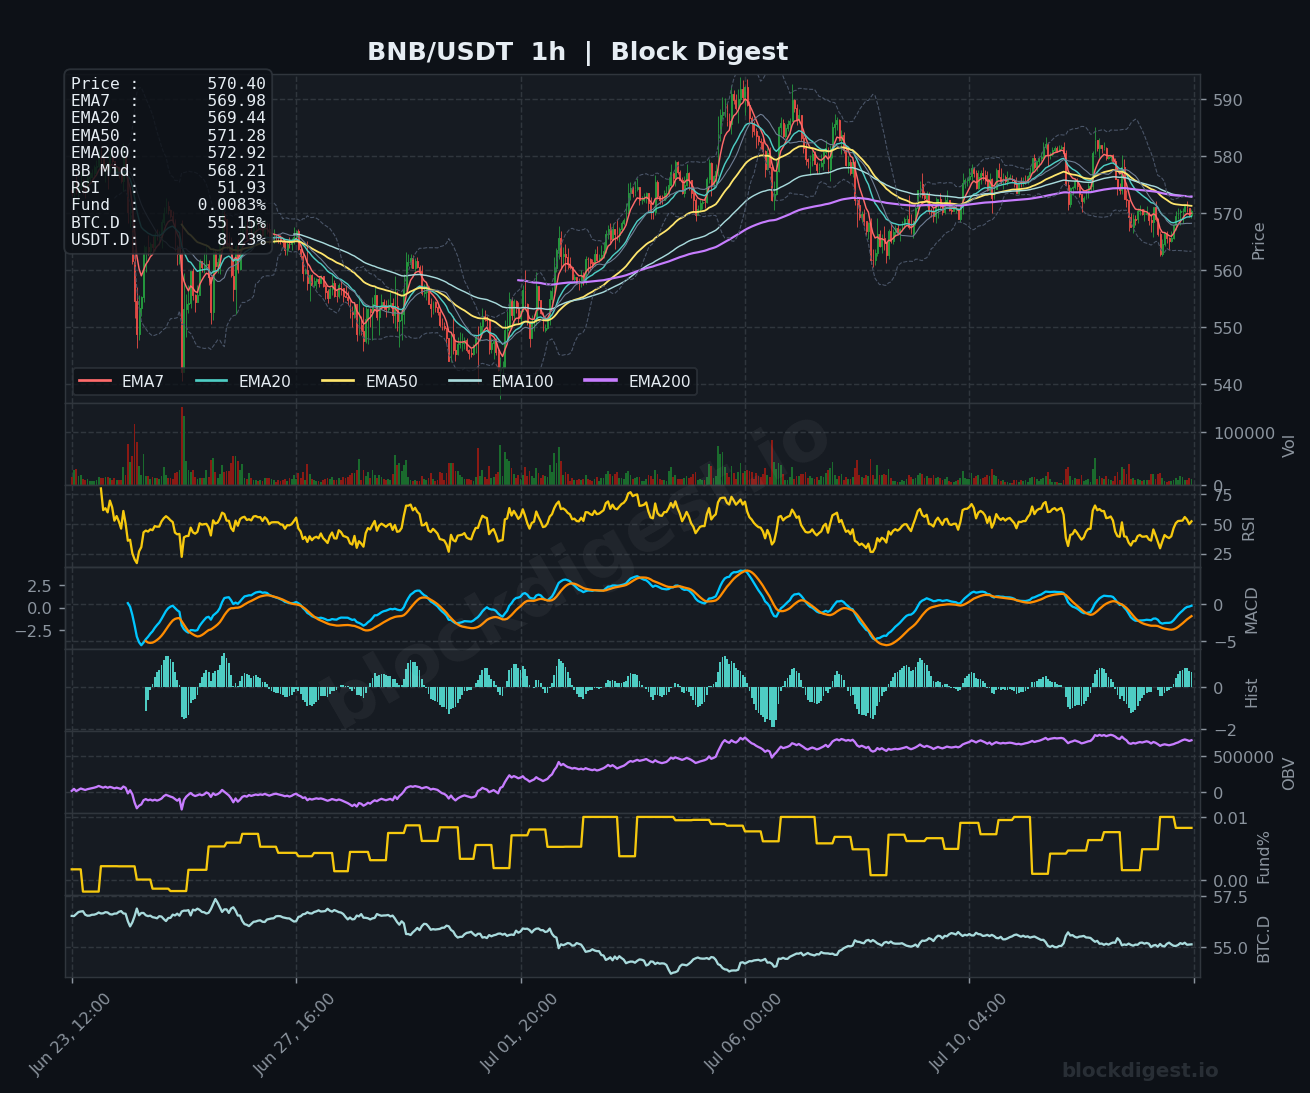
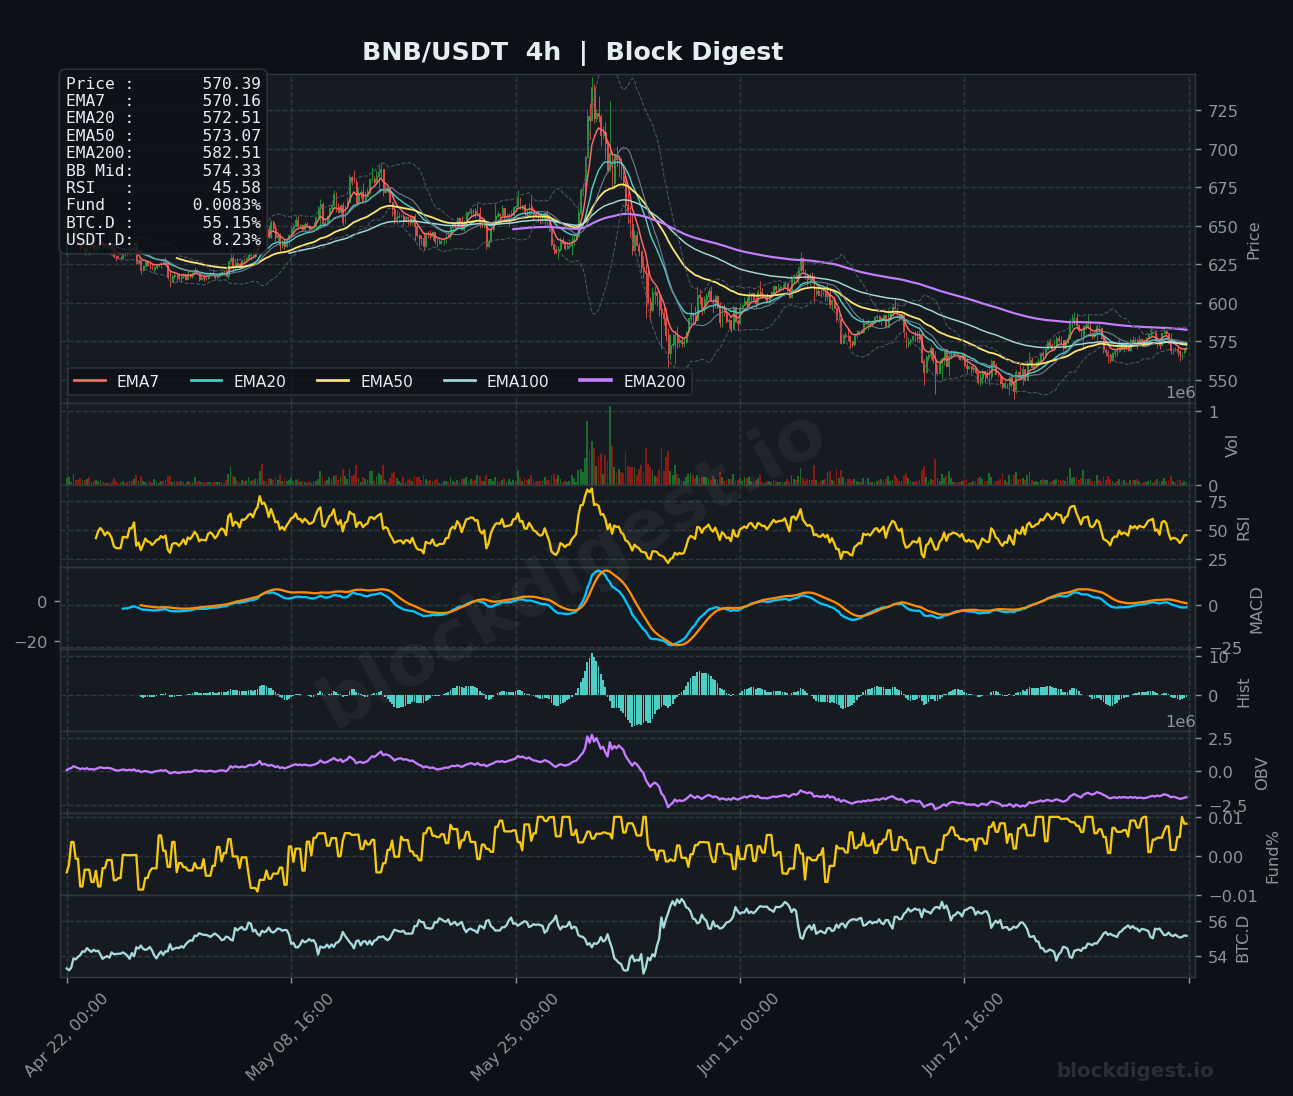
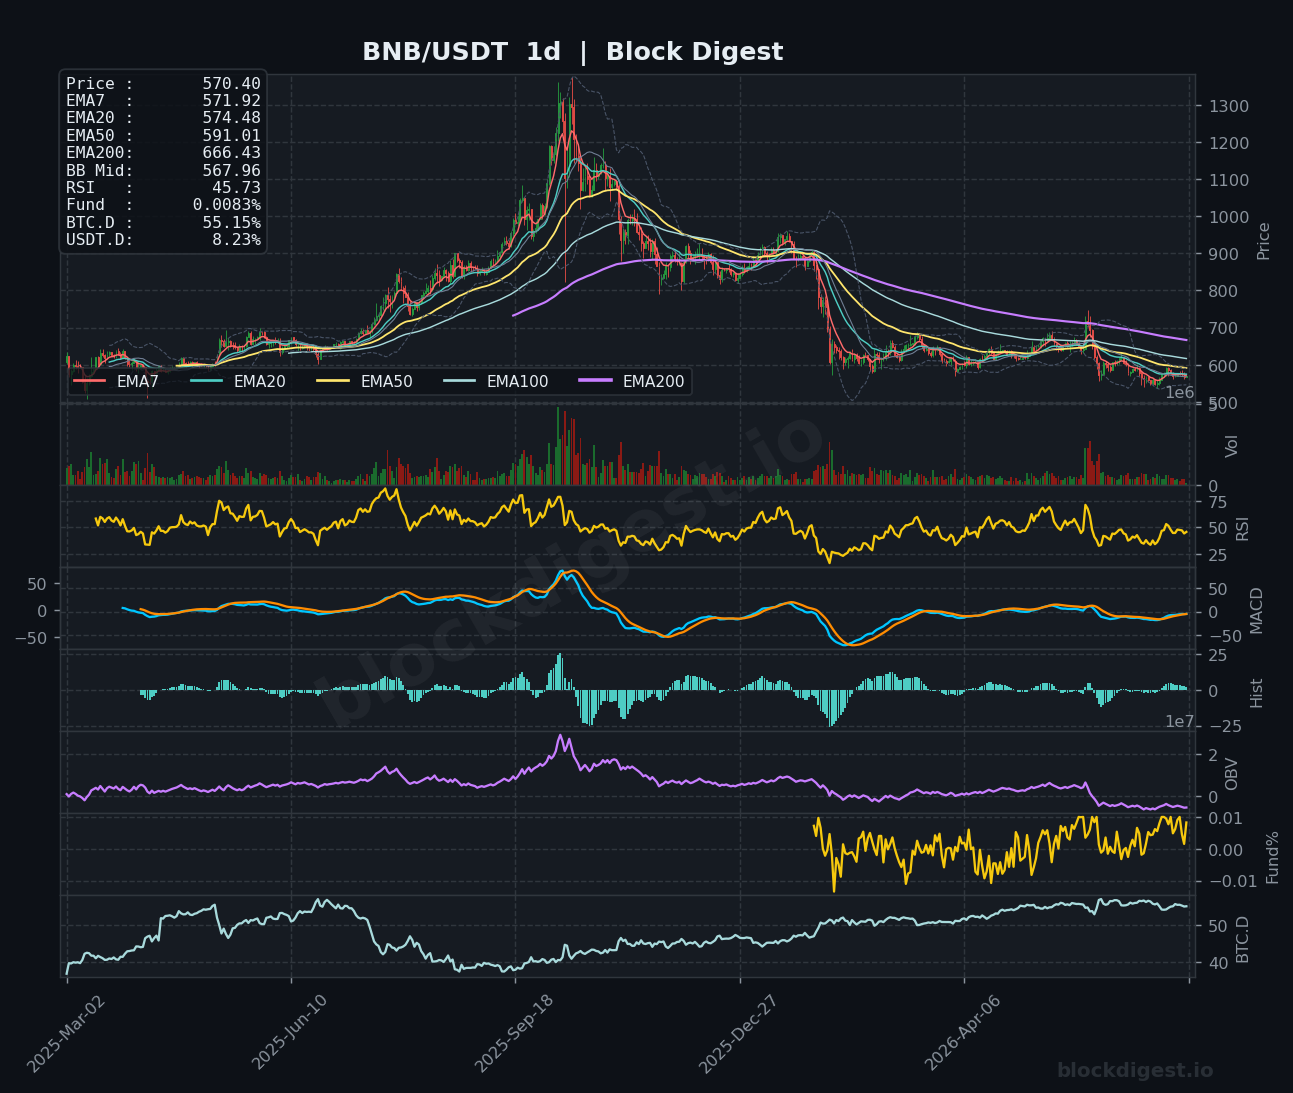
BNB is trading at $570.40, navigating a tight consolidation zone between the $565–$580 range, with all short-term EMAs (EMA7 $569.98, EMA20 $569.44, EMA50 $571.28, EMA200 $572.92) converging tightly on the 1h chart — a setup that often precedes a directional resolution. The 1h RSI at 51.93 is the most neutral reading among today’s covered assets, suggesting BNB is holding up relatively well in the current risk-off environment, though the 4h RSI at 45.58 reflects more cautious intermediate momentum. On the daily chart, the EMA200 at $666.43 remains a towering resistance far above current price, and OBV has been in a sustained downtrend since the prior highs, signaling that long-term accumulation interest remains subdued. Key support to watch is $555–$560; a breakdown there would open a retest of the lower $540s, while a breakout above $582 could target $595.
Dogecoin (DOGE)
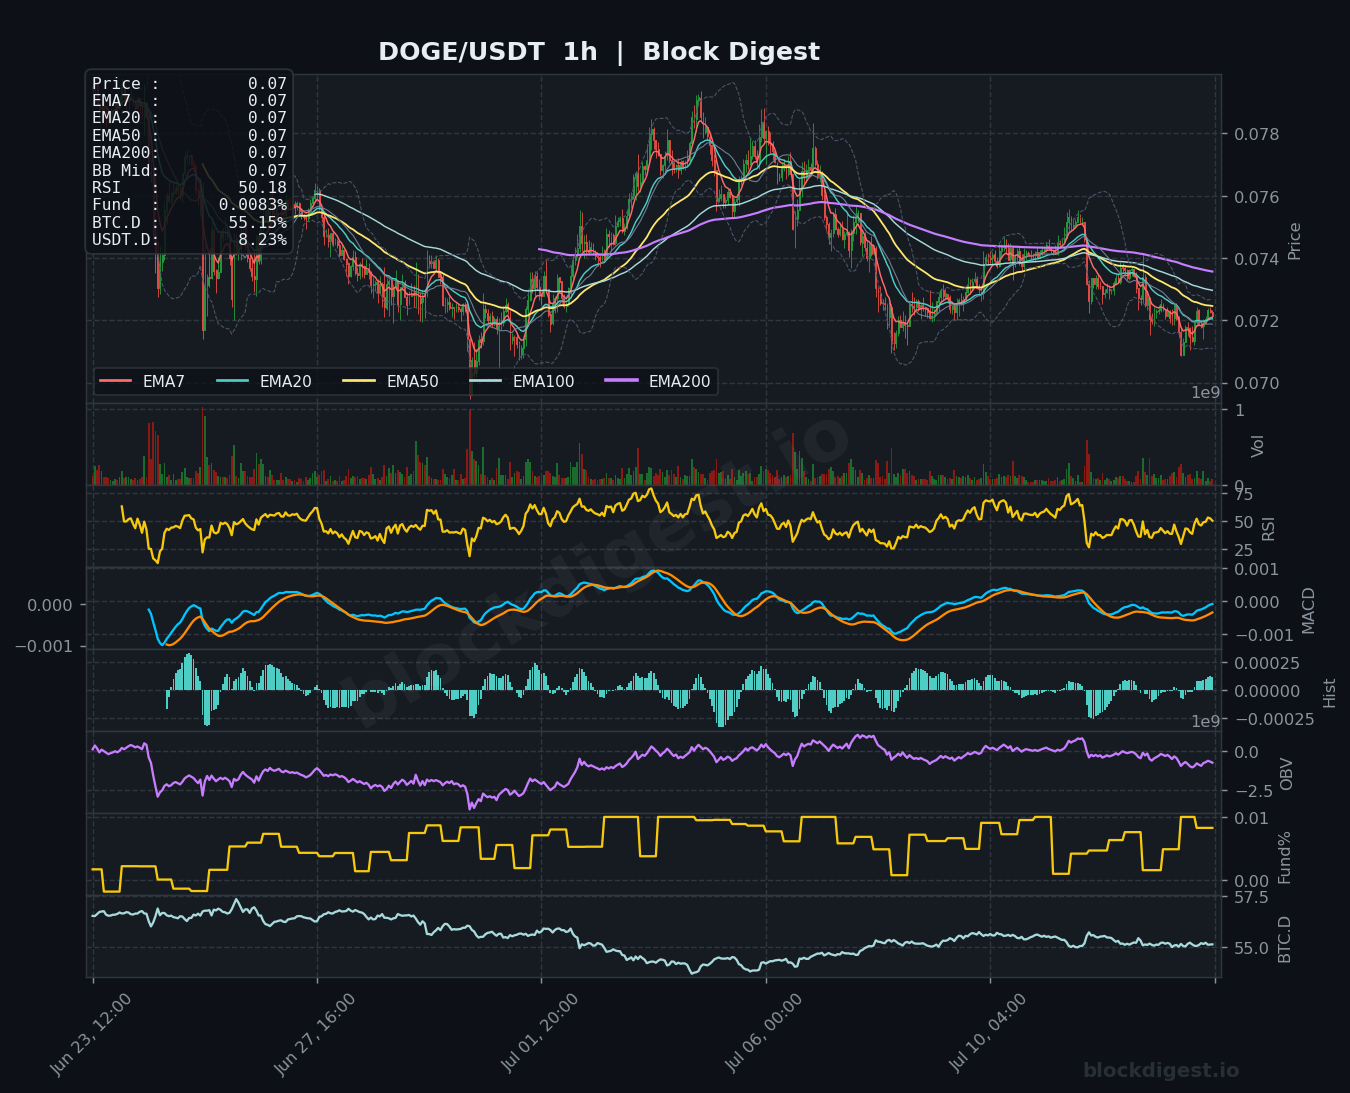
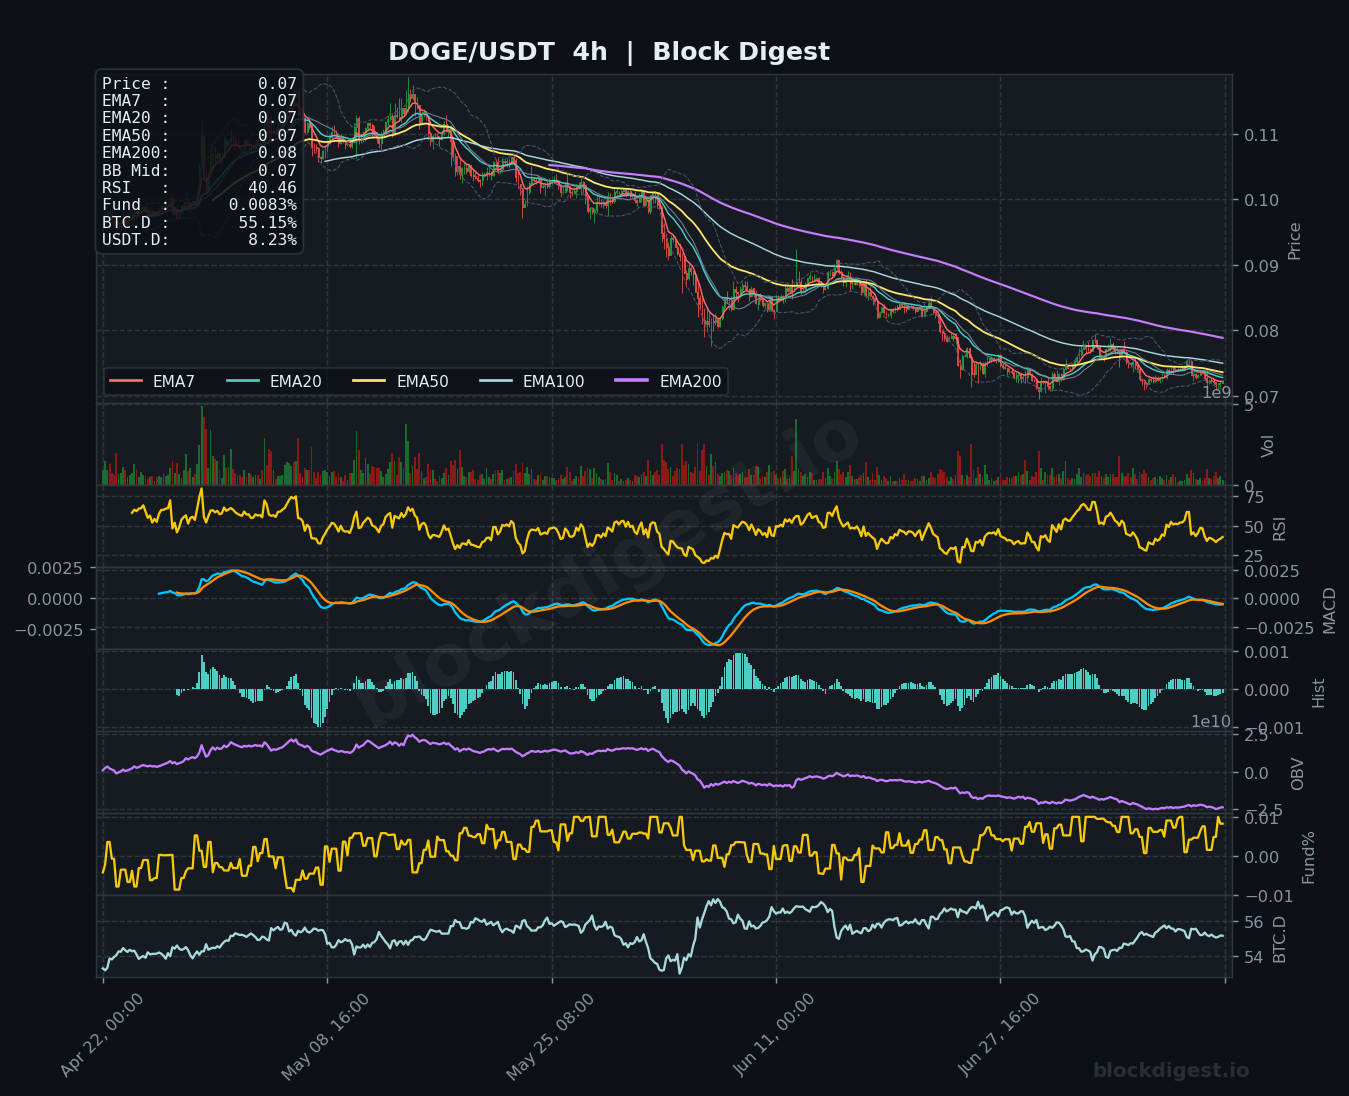
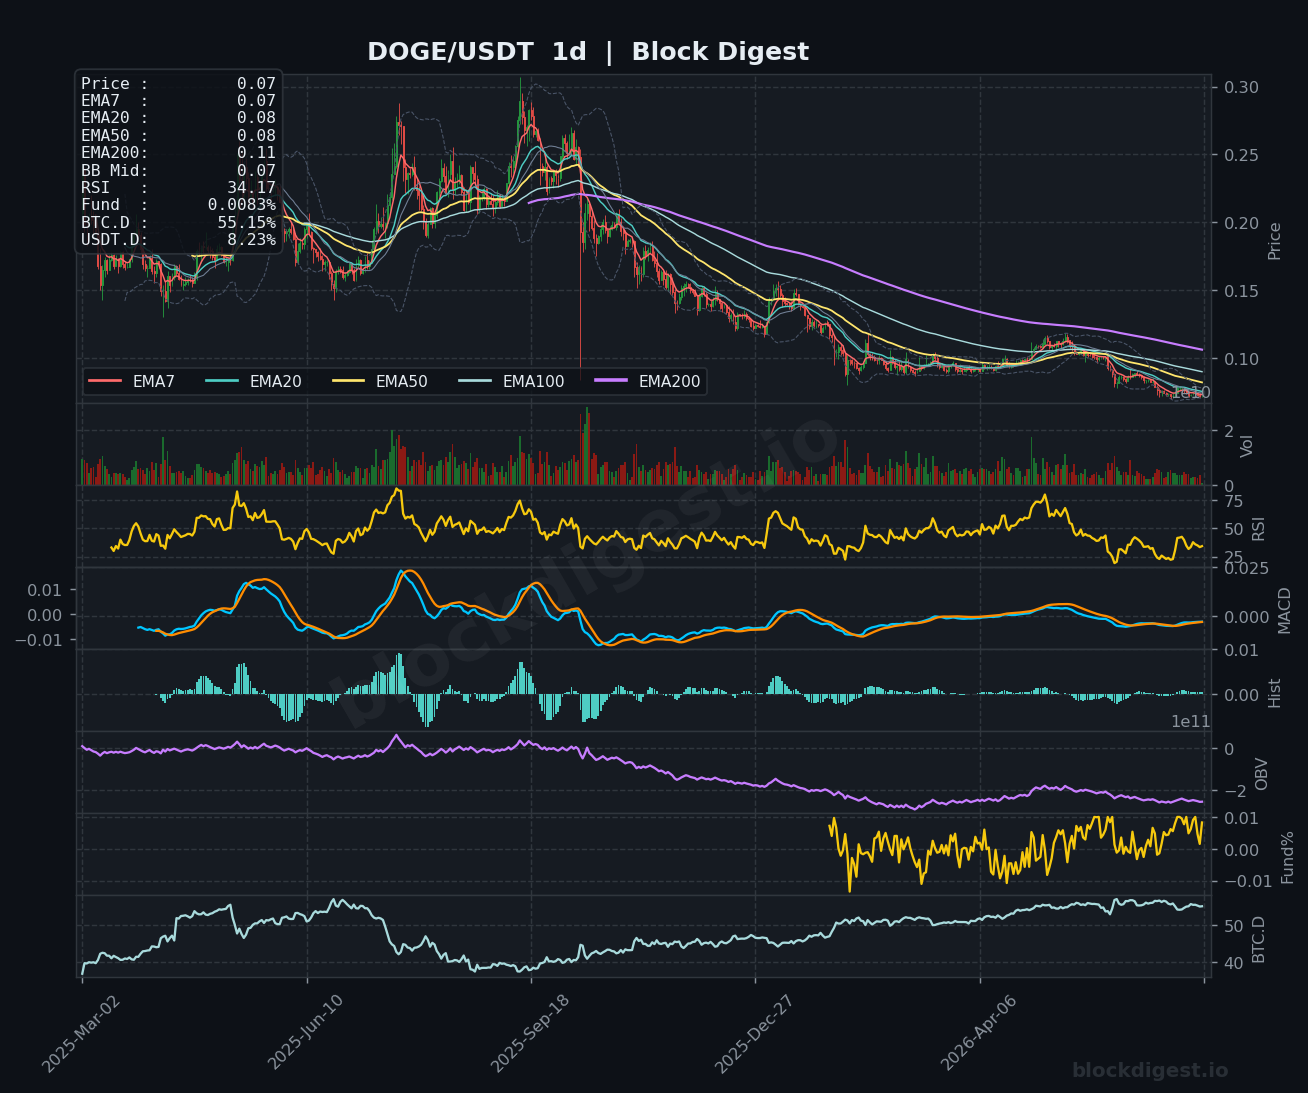
DOGE is trading at $0.0710, sitting precariously near multi-week lows and trading below all EMAs on the 4h chart (EMA200 at $0.08), with the bearish EMA stack intact and price showing no meaningful stabilization signals. The 4h RSI at 40.46 is drifting lower from the midline without reaching oversold territory, while MACD continues its negative bias — a combination that warns against premature bottom-calling. On the daily chart, RSI has collapsed to 34.17, approaching oversold conditions but without the bullish divergence needed to signal a reversal, and OBV has been in a protracted decline that mirrors the price trend. The $0.070 level represents near-term psychological support; failure to hold this zone risks a slide toward $0.065, while a recovery above $0.075 would be the first meaningful sign of stabilization.
Litecoin (LTC)
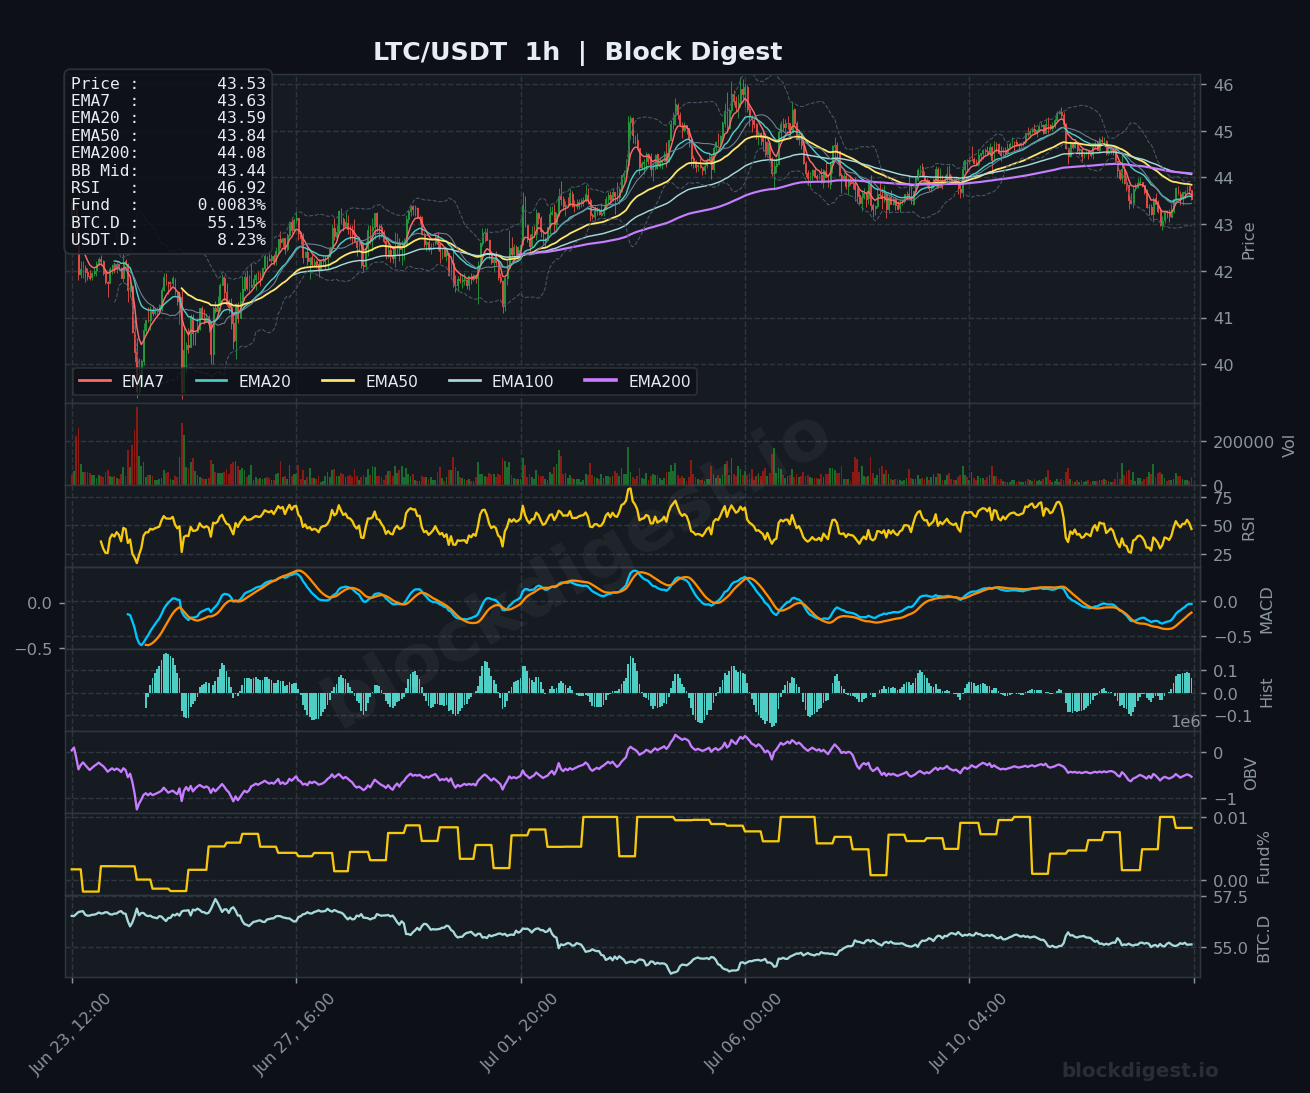
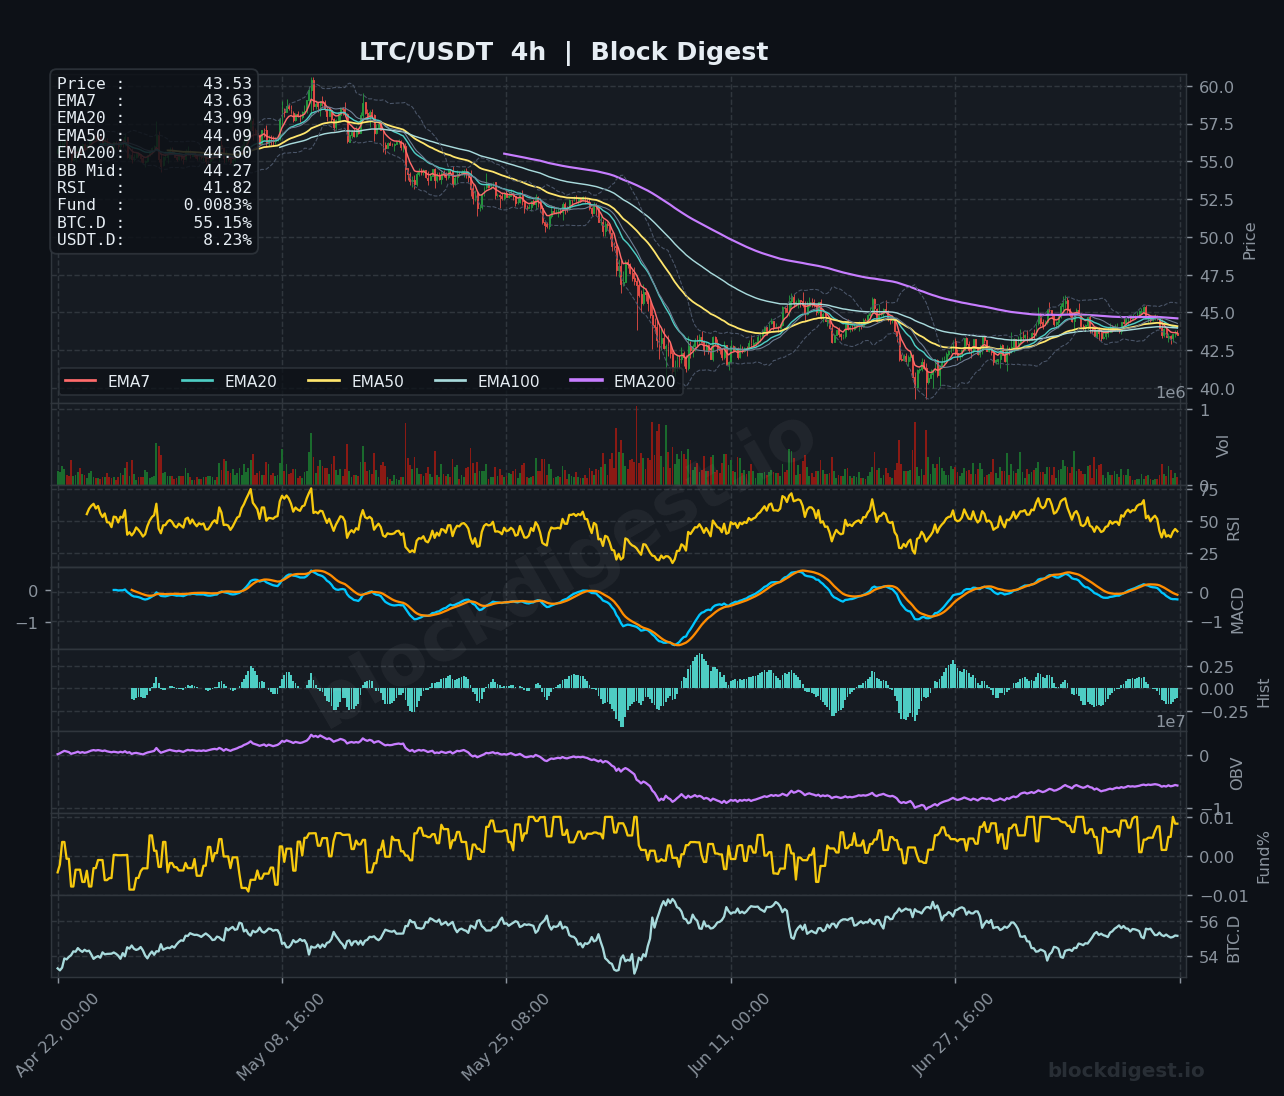
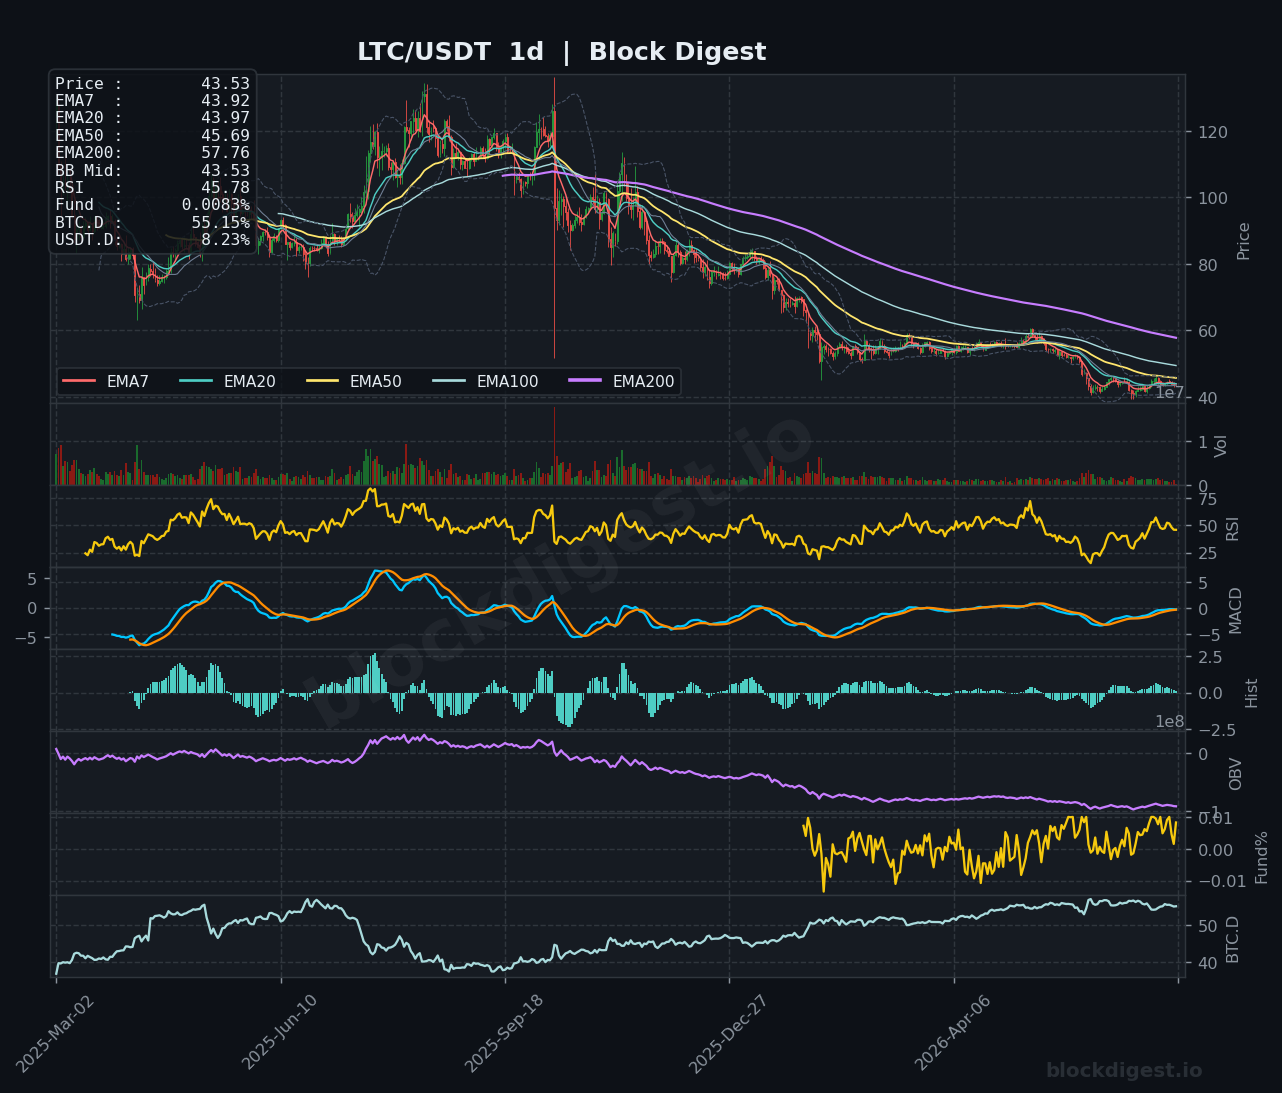
LTC is trading at $43.53, caught in a difficult range between $42.50 and $45.50, with the 4h chart showing a full bearish EMA alignment (price below EMA7 $43.63, EMA20 $43.99, EMA50 $44.09, EMA200 $44.60) and RSI at 41.82 leaning bearish. The 1h chart offers a slight glimmer of relative stability with RSI at 46.92 and MACD near zero, suggesting short-term selling pressure has moderated but not reversed. On the daily chart, the EMA200 at $57.76 remains an imposing overhead barrier, and LTC has been in a sustained downtrend since early in the year, with OBV continuing its gradual decline. Bulls need price to reclaim $45.00 and ideally the daily EMA50 at $45.69 to neutralize near-term bearish bias; below $42.00, the next meaningful support sits around $40.00.
TRON (TRX)
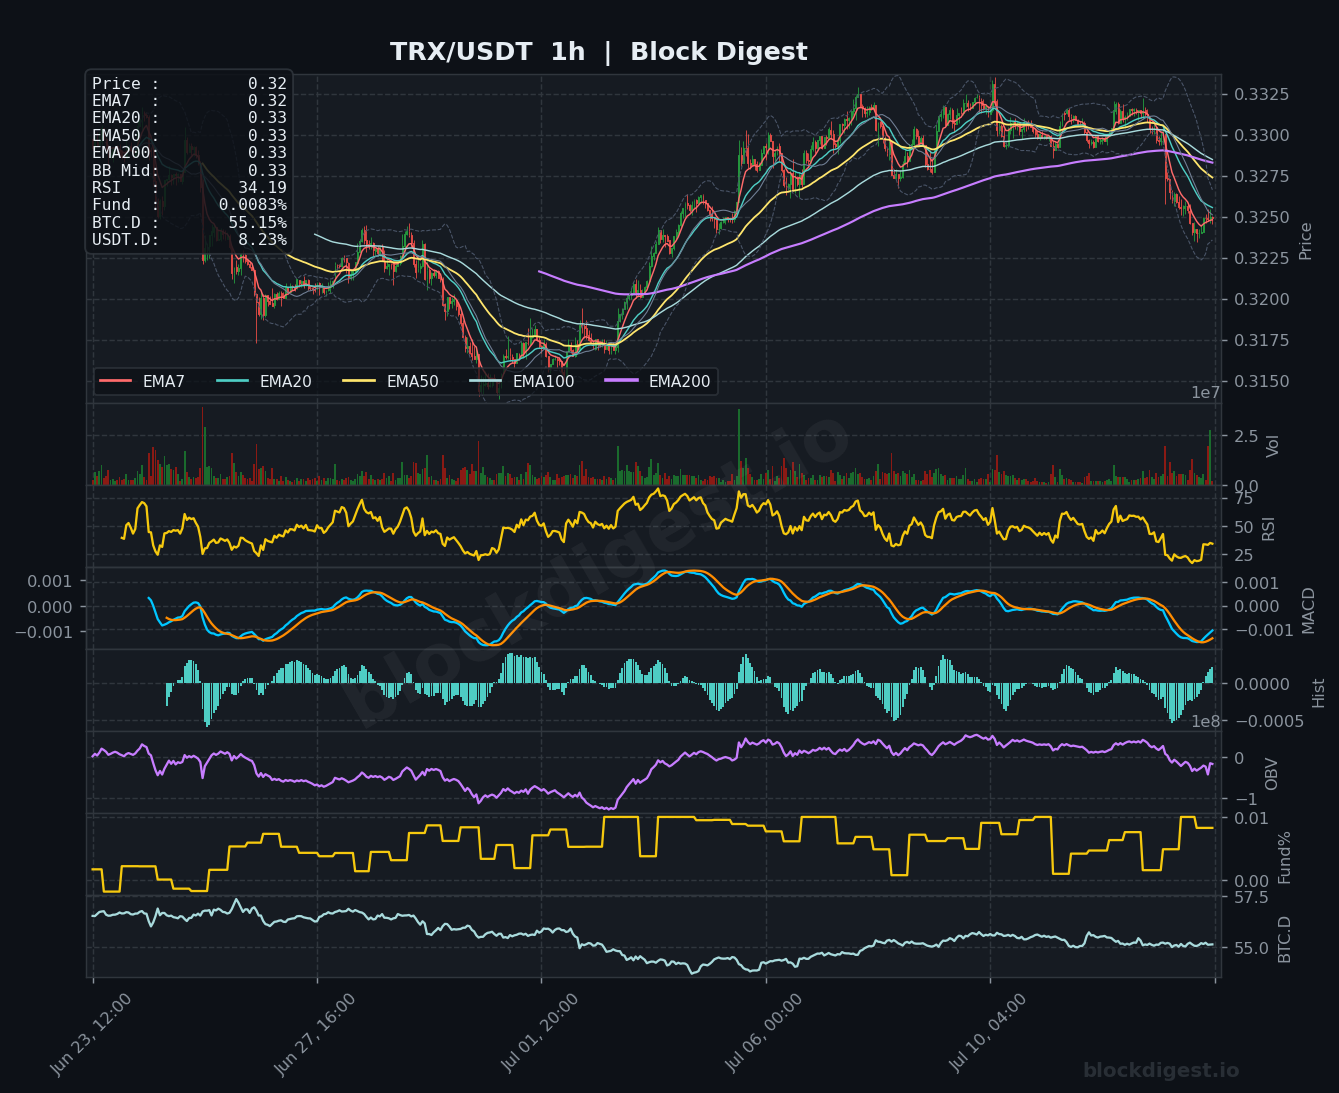
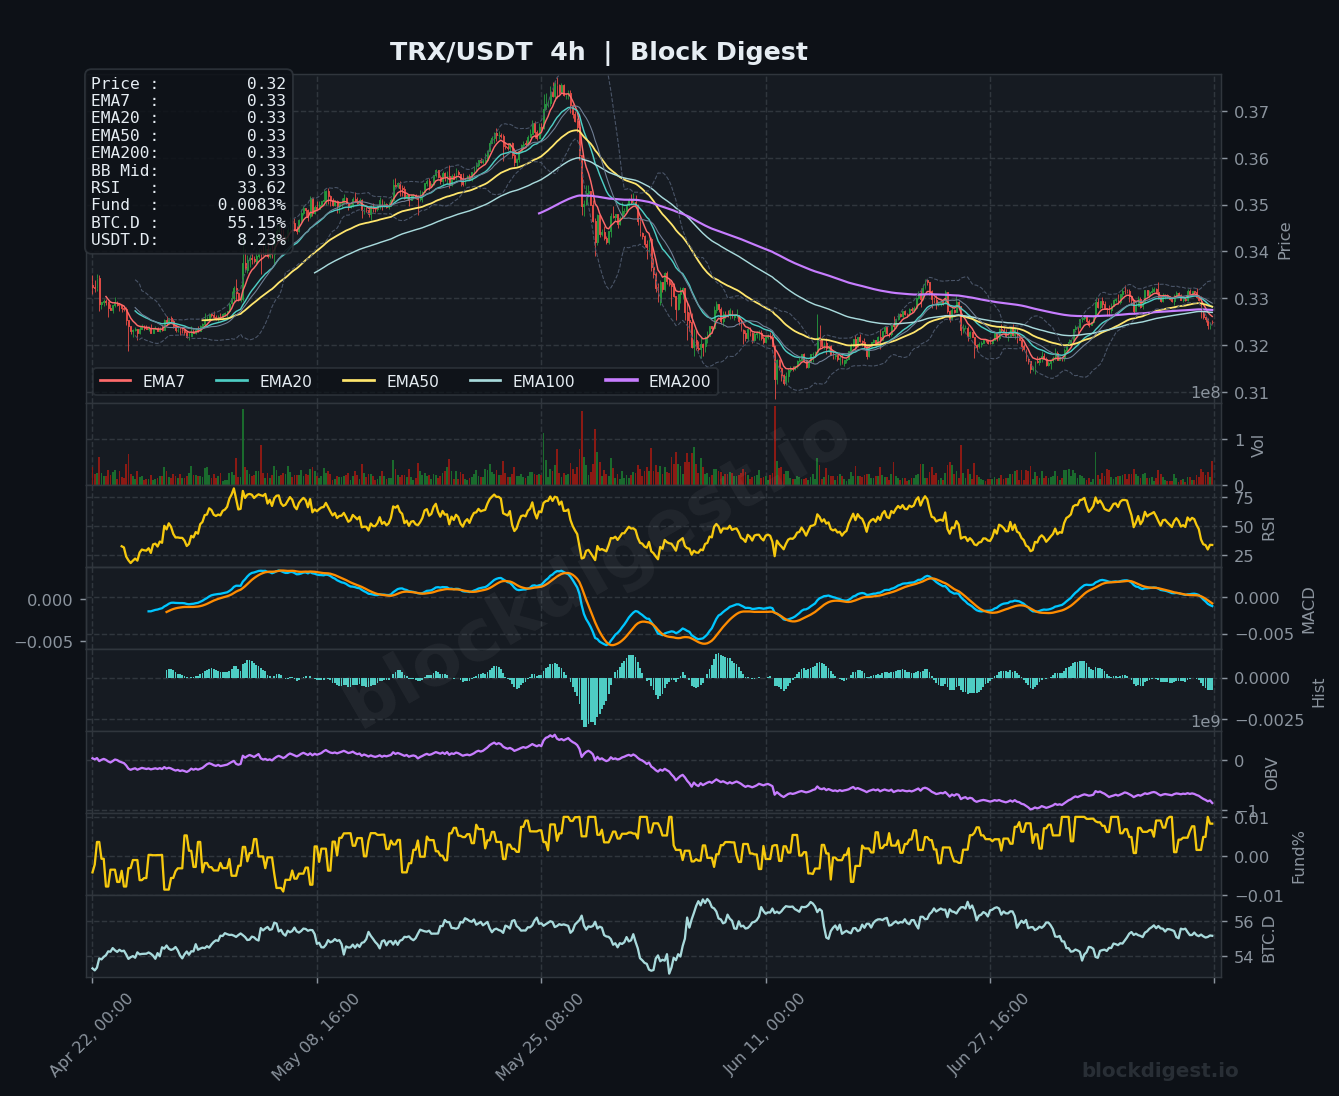
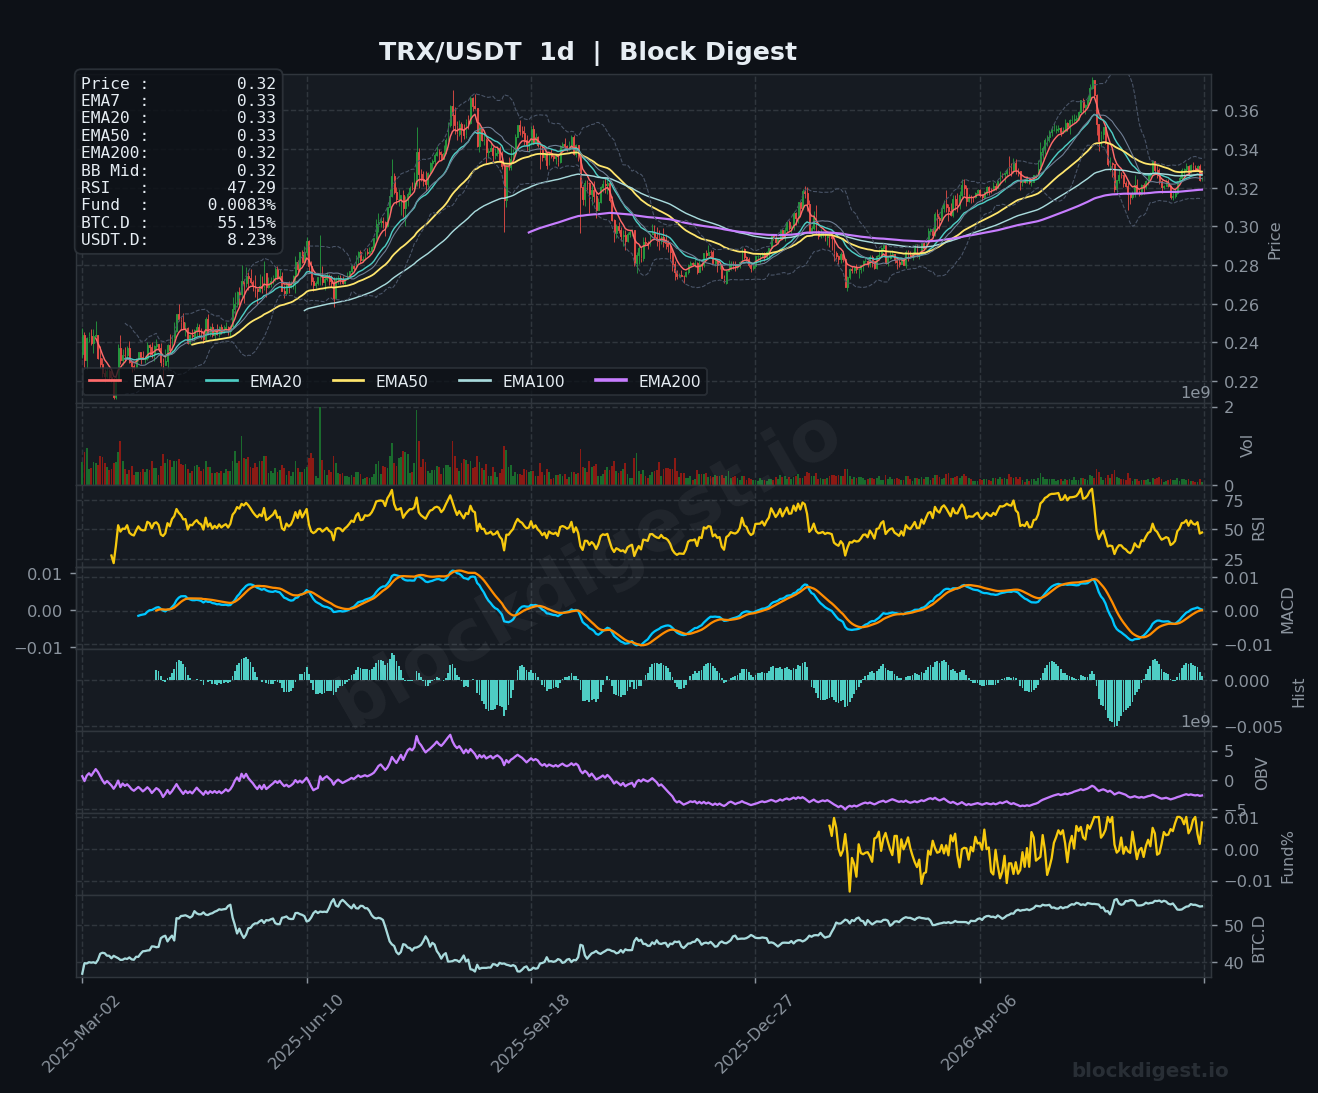
TRX is trading at $0.32, showing one of the more interesting setups among today’s coverage: the daily chart reveals the EMA200 at $0.32 is actually being tested as support, and price has held above this level with RSI at 47.29 — the highest daily RSI reading in the group, indicating relative resilience. However, the 1h and 4h charts tell a more cautious short-term story, with RSI readings of 34.19 and 33.62 respectively signaling acute near-term bearish pressure following a sharp recent pullback from the $0.335 area. The 4h MACD has crossed back into negative territory with bearish histogram bars widening, suggesting the short-term trend has turned down. Key levels to watch are $0.318 as immediate support and $0.330–$0.333 as the resistance band that must be reclaimed for bulls to regain control.
Altcoin Outlook
The collective picture across these six assets is one of a market under meaningful distribution pressure, with most coins trading below key EMA clusters on both the 4h and daily timeframes and OBV indicators uniformly trending downward. BNB and TRX are showing the most relative strength — BNB through its tight EMA consolidation and neutral RSI, and TRX through its higher daily RSI and EMA200 support test — while DOGE and XRP present the weakest technical setups with RSI readings approaching or already in oversold territory without confirming reversal signals. The primary conditions to watch are a potential drop in BTC.D below 54% to unlock altcoin capital rotation, a reversal in USDT.D from 8.23%, and whether the Fear & Greed Index can recover from Extreme Fear — none of which appear imminent without a significant catalyst. Until macro headwinds from geopolitical tensions ease and BTC demonstrates sustained directional strength, altcoins remain in a defensive posture.
Disclaimer: This analysis is for informational purposes only and does not constitute financial advice. Cryptocurrency markets are highly volatile and unpredictable. All trading decisions should be made based on your own research and risk tolerance. Block Digest is not responsible for any financial losses incurred as a result of acting on this content.