ETH Monthly Analysis — May 01, 2026
ETH Monthly Analysis – May 01, 2026
Macro Market Overview
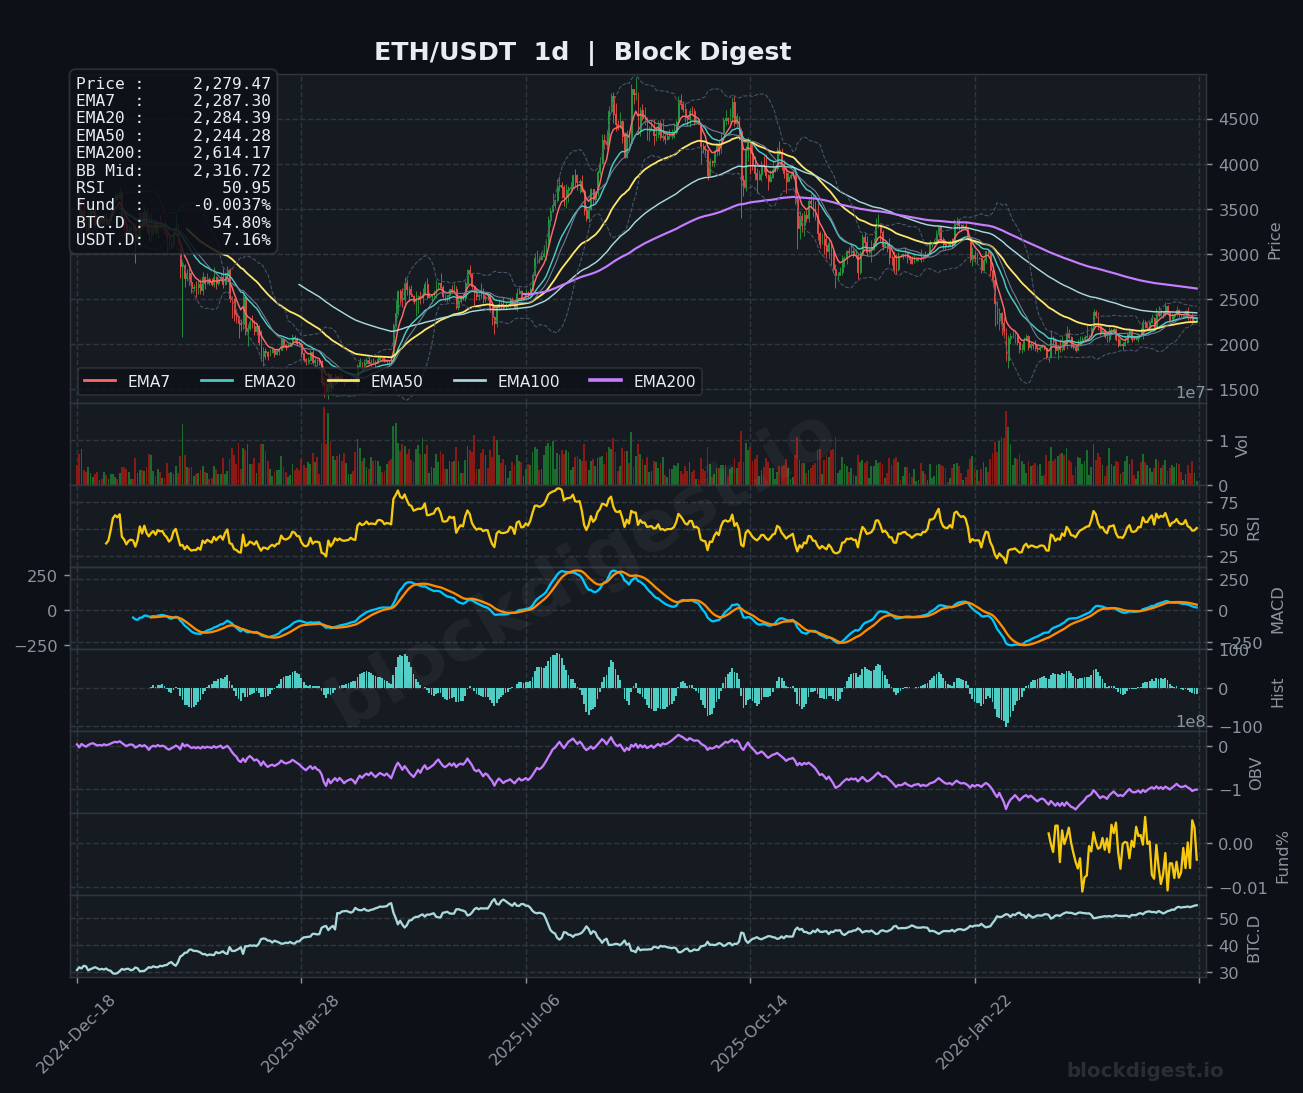
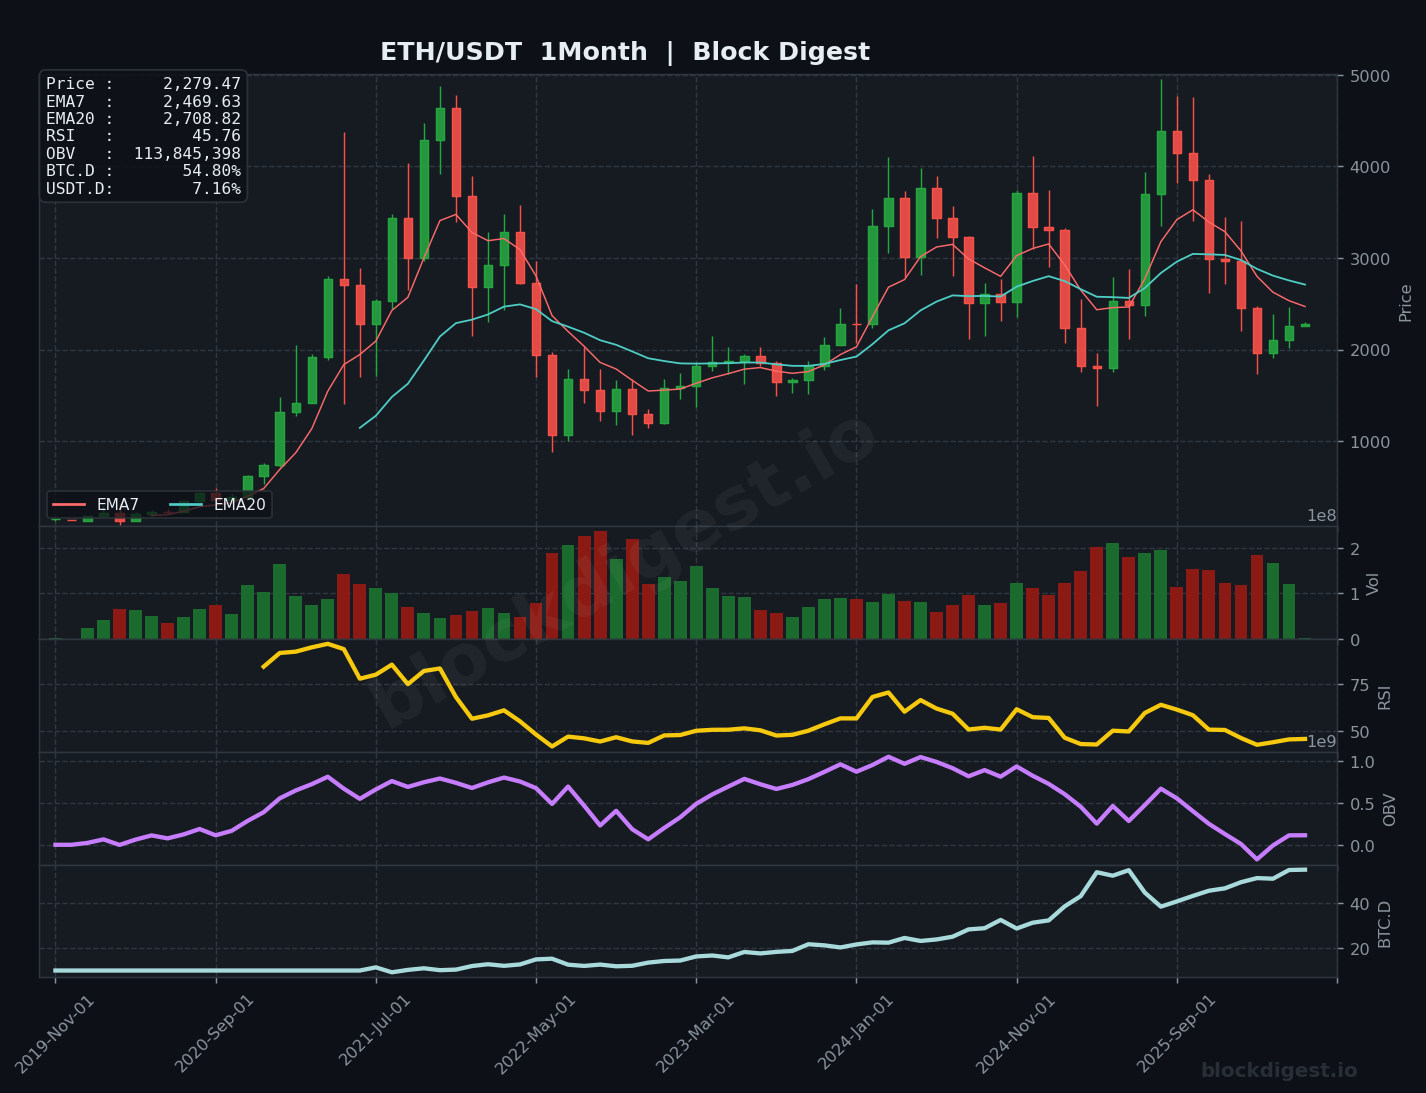
Ethereum currently trades at $2,279, positioned below both the monthly EMA7 ($2,470) and EMA20 ($2,709), indicating persistent macro bearish pressure following a significant cycle top rejection. The monthly candle structure reveals a clear distribution pattern that began following the 2025 peak near $5,200, with price now trading approximately 56% below that cycle high. ETH remains within a long-term corrective phase, having failed to reclaim the monthly EMA20 for multiple consecutive months, suggesting the market has transitioned from the euphoric markup phase into a sustained correction or potential markdown phase. The current positioning below the monthly EMA7 crossing beneath EMA20 represents a technical breakdown characteristic of bear market conditions, though historical cycle analysis suggests this may be part of a multi-year accumulation setup for the next major bull cycle.
Long-Term Trend Structure
The monthly chart reveals a critical deterioration in long-term trend structure, with the EMA7 now positioned decisively below the EMA20—a bearish configuration that has persisted through multiple monthly closes. The monthly Bollinger Bands have contracted significantly from their 2025 expansion, with price currently consolidating in the lower half of the band structure, indicating reduced volatility and potential energy accumulation for the next major directional move. Historical resistance zones that previously acted as support during the 2023-2025 bull run ($3,500-$3,800 and $4,200-$4,500) now represent formidable overhead supply levels that must be reclaimed to validate any sustained reversal. The current monthly RSI reading of 45.76 sits near neutral territory but below the 50 midpoint, reflecting weakening momentum without reaching the deeply oversold readings (sub-30) that historically mark major cycle bottoms—suggesting further time or downside may be required before establishing a durable macro low. From a cycle perspective, ETH appears to be in a mid-stage correction phase, potentially mirroring the 2018-2019 accumulation pattern where months of consolidation preceded the next major markup phase.
Weekly Timeframe Context
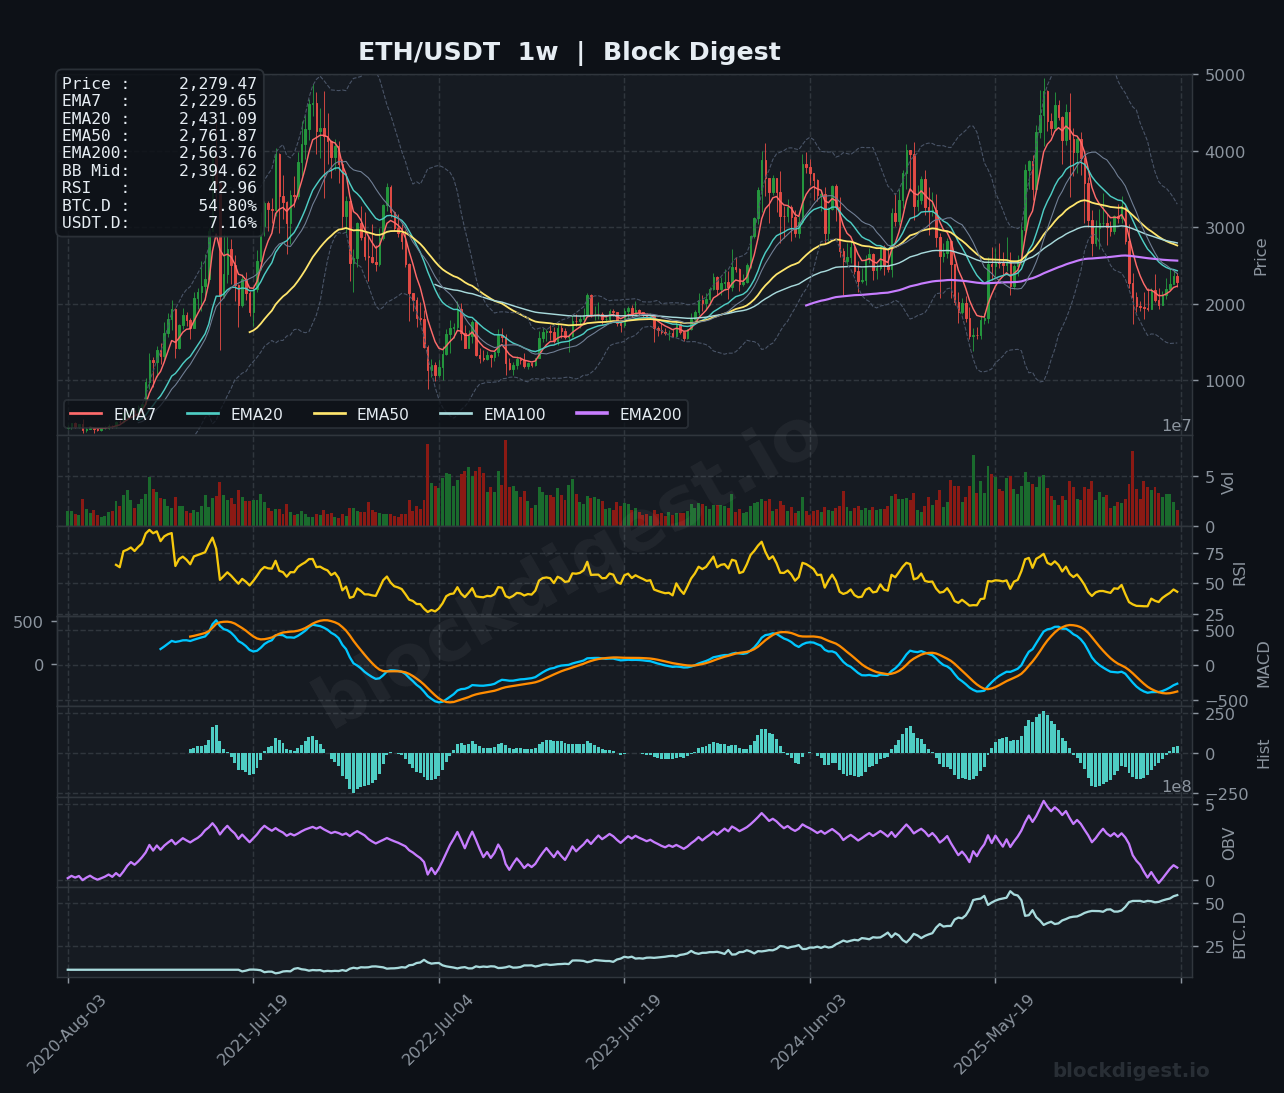
The weekly timeframe bridges the monthly bearish structure with more immediate technical developments, showing price currently testing the weekly EMA200 ($2,504) from below after multiple rejection attempts. Weekly EMA alignment remains bearish with shorter-term moving averages compressed below longer-term averages, though the rate of decline has decelerated, suggesting exhaustion of immediate selling pressure. The weekly chart displays a series of lower highs since the cycle peak, with the most recent bounce attempt from the $1,600 lows now consolidating between $2,100-$2,500, creating a critical decision zone that will determine whether ETH establishes a higher low structure or resumes the primary downtrend. This weekly consolidation pattern beneath the EMA200 represents a typical re-accumulation structure seen in previous cycle corrections, where patient institutional capital gradually absorbs supply before the next leg higher.
Key Macro Levels
Major Resistance:
- $2,700-$2,800: Monthly EMA20 and psychological resistance; reclaiming this level would signal the first major trend reversal indication and likely trigger significant short covering
- $3,200-$3,500: Previous cycle support turned resistance; historical accumulation zone from 2023 that now represents a critical supply zone
- $4,000-$4,200: Major psychological level and previous distribution area from early 2025; breaking above would confirm a new bull market structure
- $5,200-$5,400: Previous cycle high and major distribution top; ultimate resistance that would need to break for new all-time highs
Major Support:
- $2,100-$2,200: Current weekly consolidation low and immediate support; losing this level would resume the primary downtrend
- $1,600-$1,800: Previous panic low from earlier in 2026; represents extreme fear zone and potential higher low if retested with positive divergence
- $1,200-$1,400: Historical accumulation zone from 2022-2023 cycle low; this area would represent a retest of previous cycle bottom and likely mark maximum pain
- $880-$1,000: Absolute worst-case scenario representing the 2022 bear market low; this level would only come into play in a full cycle reset
Momentum & Accumulation Analysis
The monthly RSI at 45.76 resides in neutral territory, significantly above the deeply oversold readings below 30 that historically marked major cycle bottoms in 2018 and 2022, suggesting the current correction may require additional time or price compression before establishing a durable low. On-Balance Volume (OBV) on the monthly chart shows a gradual decline from peak levels but has not experienced the catastrophic selling volume seen during previous capitulation events, indicating that while distribution has occurred, panic liquidation has been largely absent—a potentially constructive sign for long-term accumulation. The weekly MACD remains in bearish territory with both lines below zero, though the histogram shows decreasing negative momentum and early signs of potential bullish convergence, suggesting the rate of decline is slowing and a medium-term bottom formation may be developing. Comparing current momentum readings to previous cycle lows, ETH exhibits characteristics of mid-cycle correction rather than final capitulation, with RSI maintaining structure above panic levels and OBV suggesting gradual rather than catastrophic distribution.
BTC Dominance – Cycle Context
Bitcoin dominance currently sits at 54.80%, reflecting a multi-month uptrend where capital has rotated from altcoins back into Bitcoin—a typical pattern during corrective phases when market participants seek relative safety. This elevated dominance reading suggests the market remains in a “risk-off” mode within the crypto ecosystem, with altcoins including ETH underperforming BTC as the market digests previous excesses. USDT dominance at 7.16% remains relatively subdued, indicating that despite the correction, capital has not massively fled to stablecoins, which would signal extreme bearish sentiment; instead, this suggests rotation within crypto rather than wholesale exit. The current configuration with rising BTC.D and stable USDT.D typically characterizes the late stages of altcoin corrections, where Bitcoin establishes a bottom first before dominance peaks and capital eventually rotates back into high-quality altcoins like ETH during the next “altcoin season”—a pattern that historically precedes major ETH rallies by 2-4 months.
Risk Scenarios
Bull Case: A successful defense of the $2,100-$2,200 support zone coupled with reclamation of the monthly EMA7 ($2,470) would confirm a higher low structure and potentially mark the beginning of a new accumulation phase leading into the next bull cycle. Monthly close above $2,800 (EMA20) would trigger significant technical breakout, likely propelling ETH toward the $3,200-$3,500 resistance zone and validating a trend reversal with potential targets of $4,000+ as Bitcoin dominance peaks and altcoin season begins. The macro bull case is supported by constructive OBV structure, decreasing selling momentum, and historical cycle patterns suggesting this correction duration aligns with previous mid-cycle consolidations that preceded 100%+ rallies.
Bear Case: Failure to hold the $2,100-$2,200 support zone would resume the primary downtrend and likely trigger a retest of the $1,600-$1,800 panic lows, with potential for further deterioration toward the $1,200-$1,400 zone if monthly RSI breaks below 40. A bearish monthly close below $2,000 accompanied by expanding Bollinger Bands to the downside would signal renewed distribution and could indicate the market is entering a prolonged bear phase similar to 2018, where 12-18 months of base-building were required. The bear scenario is supported by continued BTC dominance expansion above 55%, persistent trading below monthly EMA20, and potential macro liquidity contraction that could pressure risk assets including crypto.
Monthly Outlook
As we move through May 2026, Ethereum finds itself at a critical juncture within the larger market cycle, trading in a decision zone that will likely determine the character of the next 6-12 months. The balance of probabilities suggests ETH is forming a prolonged accumulation base rather than entering terminal decline, supported by constructive volume patterns, stabilizing momentum indicators, and historical cycle timing that typically sees major lows form 12-18 months after cycle peaks. Key levels to monitor include the immediate $2,100 support (a break would be concerning) and the $2,700-$2,800 resistance zone (reclaiming would be decisively bullish). With BTC dominance likely approaching a cyclical peak and USDT dominance remaining contained, the macro setup increasingly fav
Disclaimer: This analysis is for informational purposes only and does not constitute financial advice. Cryptocurrency markets are highly volatile and unpredictable. All trading decisions should be made based on your own research and risk tolerance. Block Digest is not responsible for any financial losses incurred as a result of acting on this content.
