Altcoin Daily Analysis: Altcoins Recover as BTC Dominance Holds 56.62%
Market Context
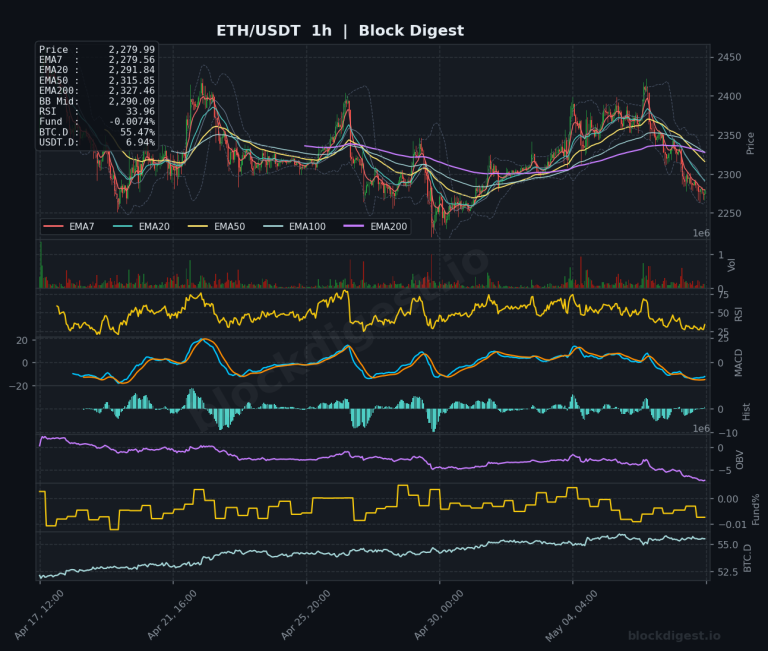
The broader altcoin market is showing signs of a tentative recovery after a sustained multi-week correction, with most major altcoins attempting to reclaim short-term moving averages. BTC dominance sitting at 56.62% signals that capital rotation into altcoins remains limited, as Bitcoin continues to command a significant share of market flows. USDT.D at 8.02% suggests risk appetite is cautious but not at extreme fear levels, leaving room for selective altcoin positioning if Bitcoin maintains stability.
Solana (SOL)
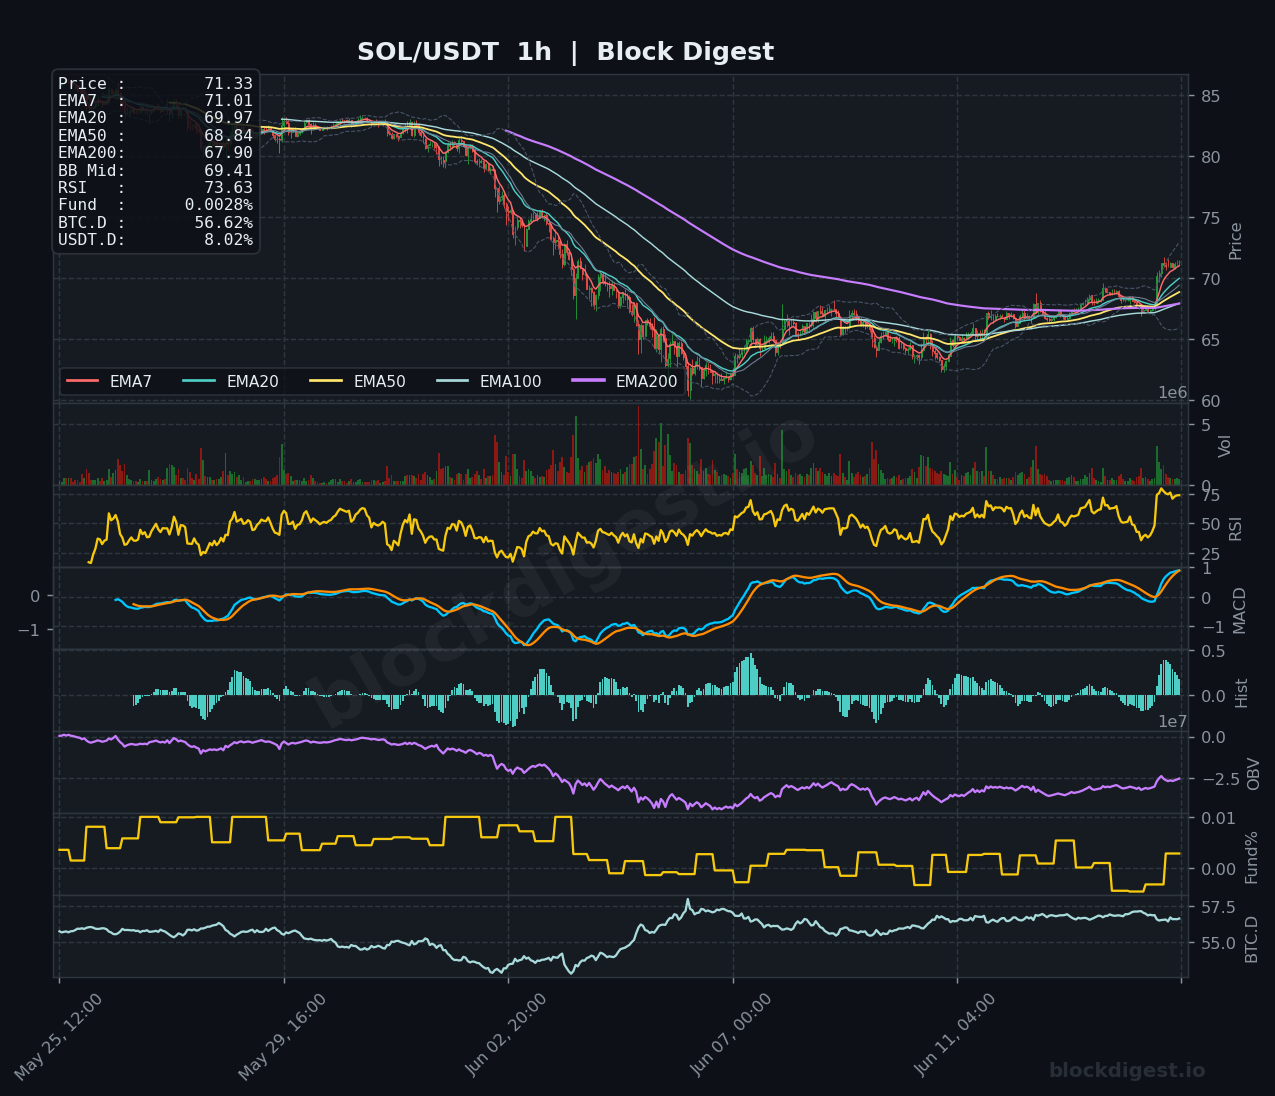
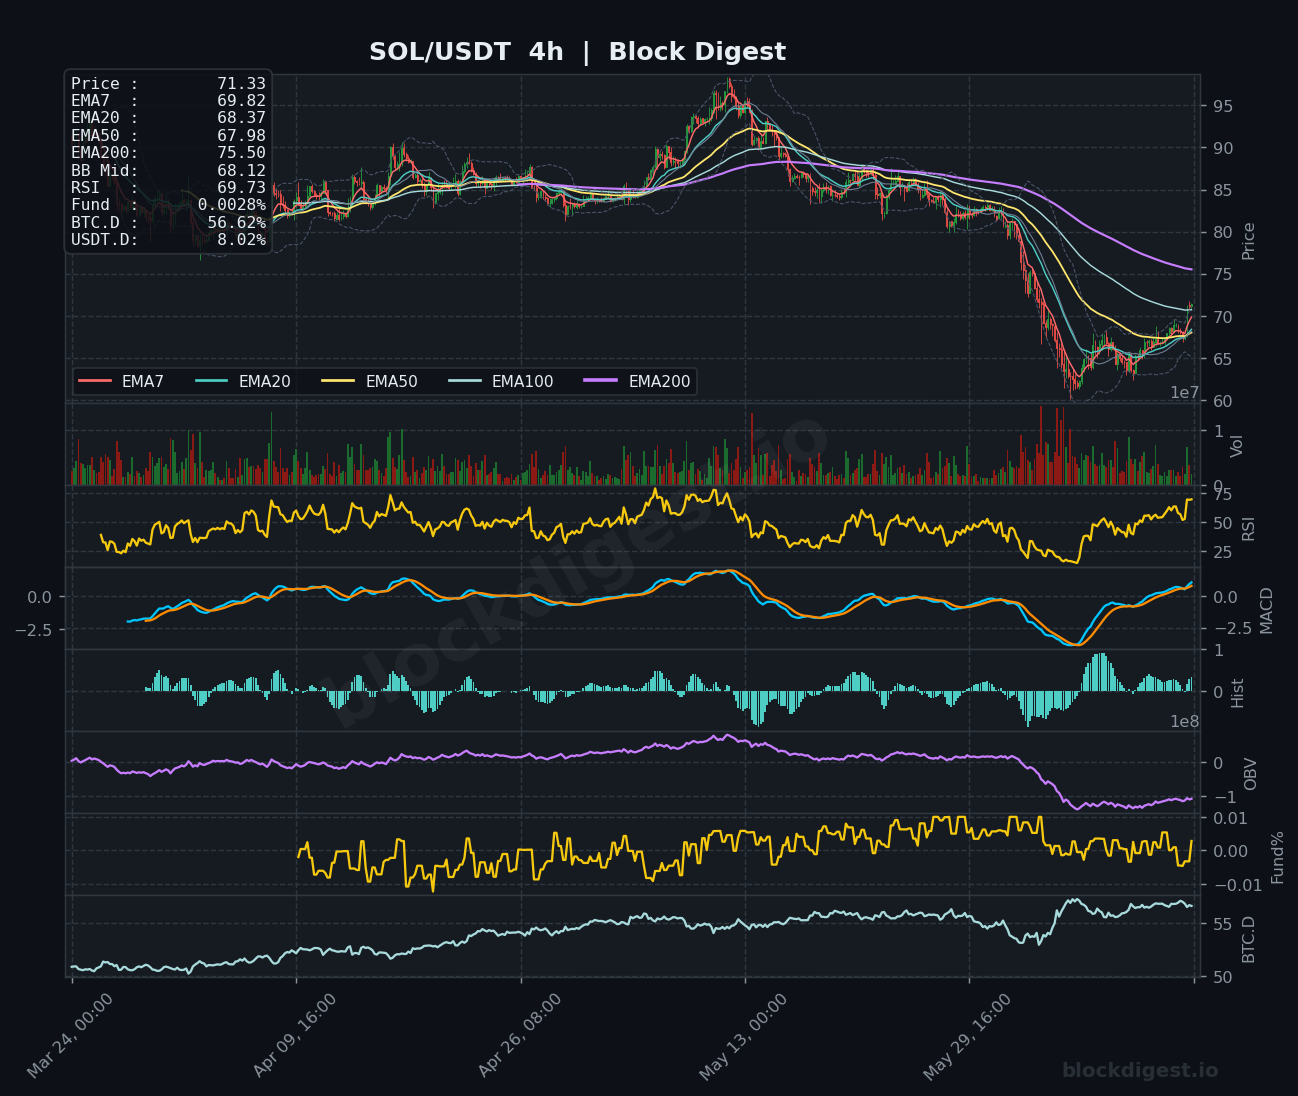
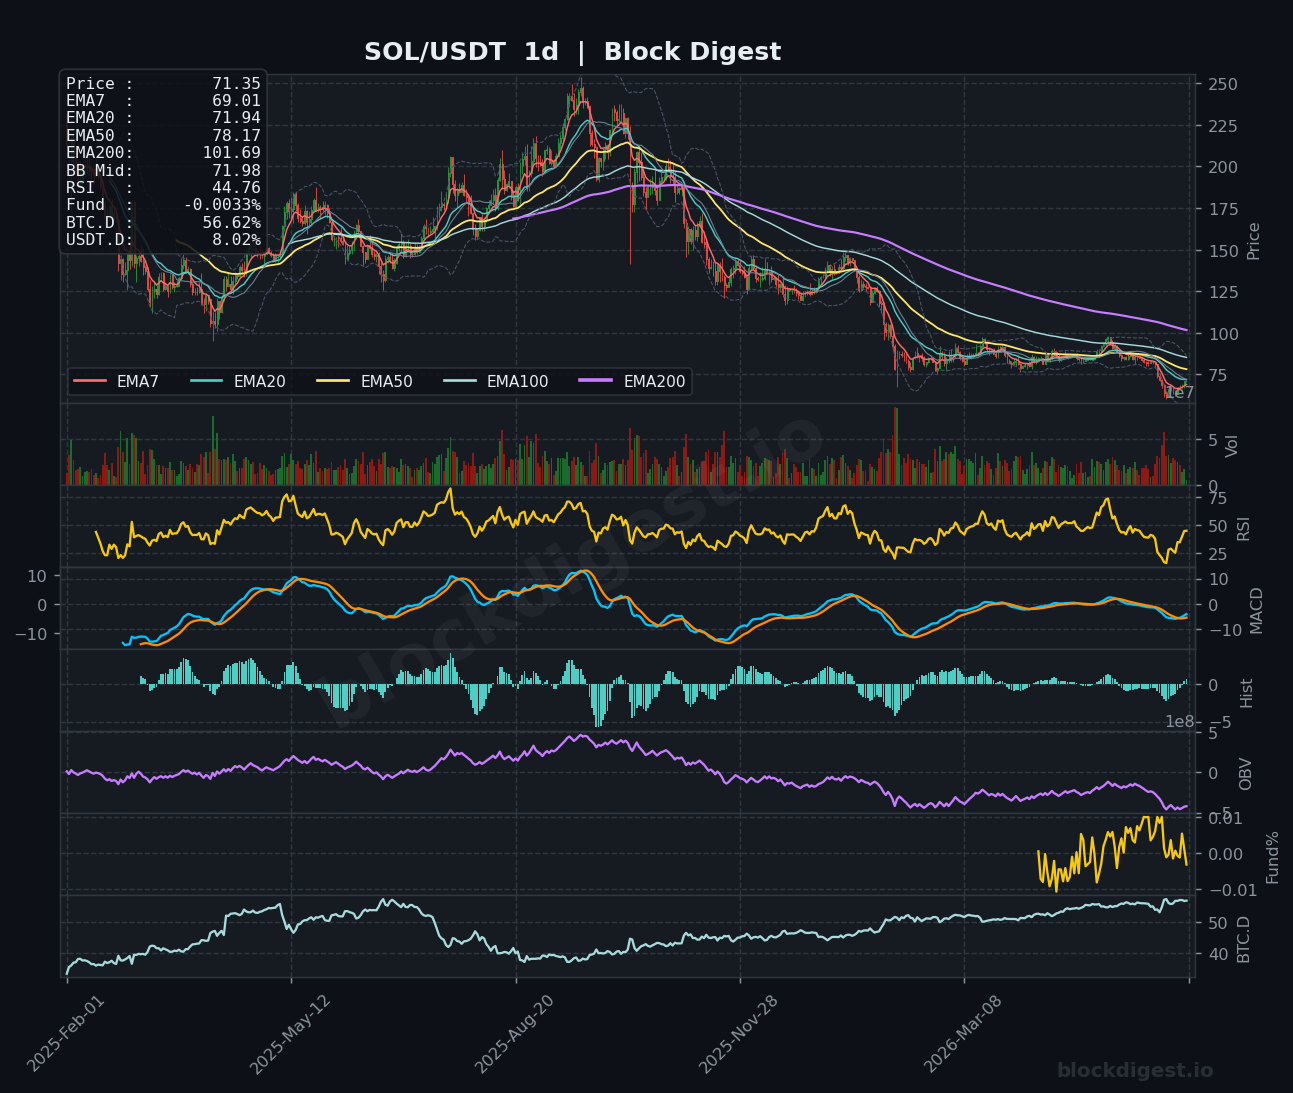
SOL is currently trading at $71.33, with the 1h chart showing a sharp recovery from recent lows near $63, with price now trading above all short-term EMAs (EMA7: $71.01, EMA20: $69.97, EMA50: $68.84). The 1h RSI has climbed to 73.63, entering overbought territory, while the MACD is in a clear bullish crossover with a rising histogram — momentum is firmly to the upside on the short-term frame. However, the daily chart tells a more sobering story: SOL remains well below its EMA50 ($78.17) and EMA200 ($101.69), with daily RSI at just 44.76 and OBV still in a downtrend, underscoring that the macro trend remains bearish. The short-term bias is cautiously bullish, but bulls need to clear the $75–$78 resistance zone decisively to build confidence in a sustained reversal.
XRP (XRP)
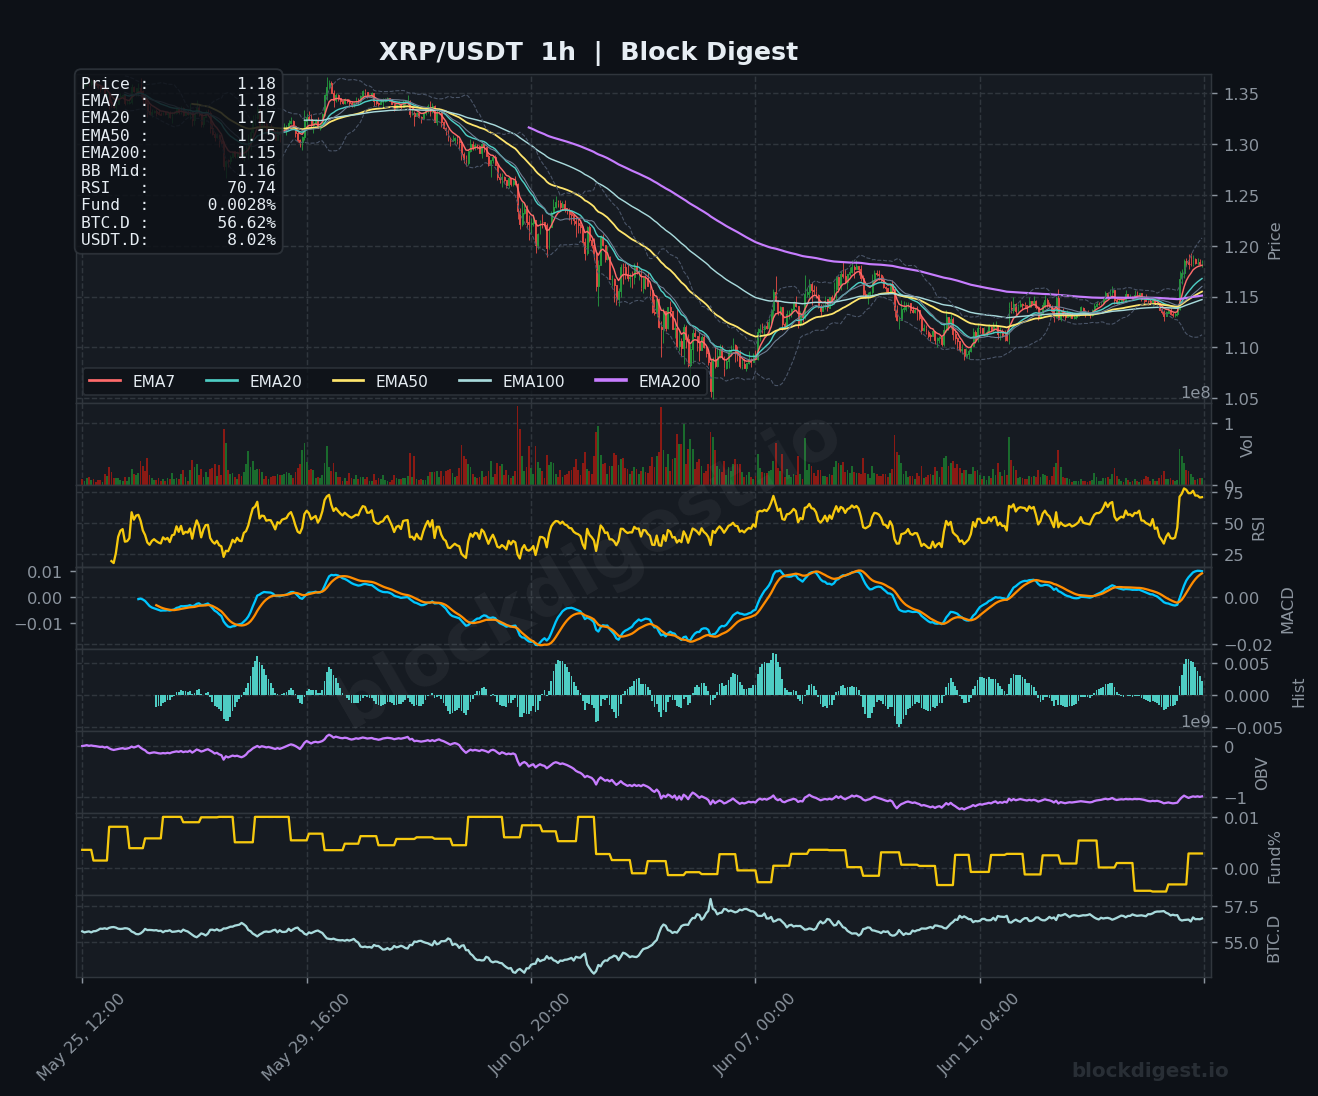
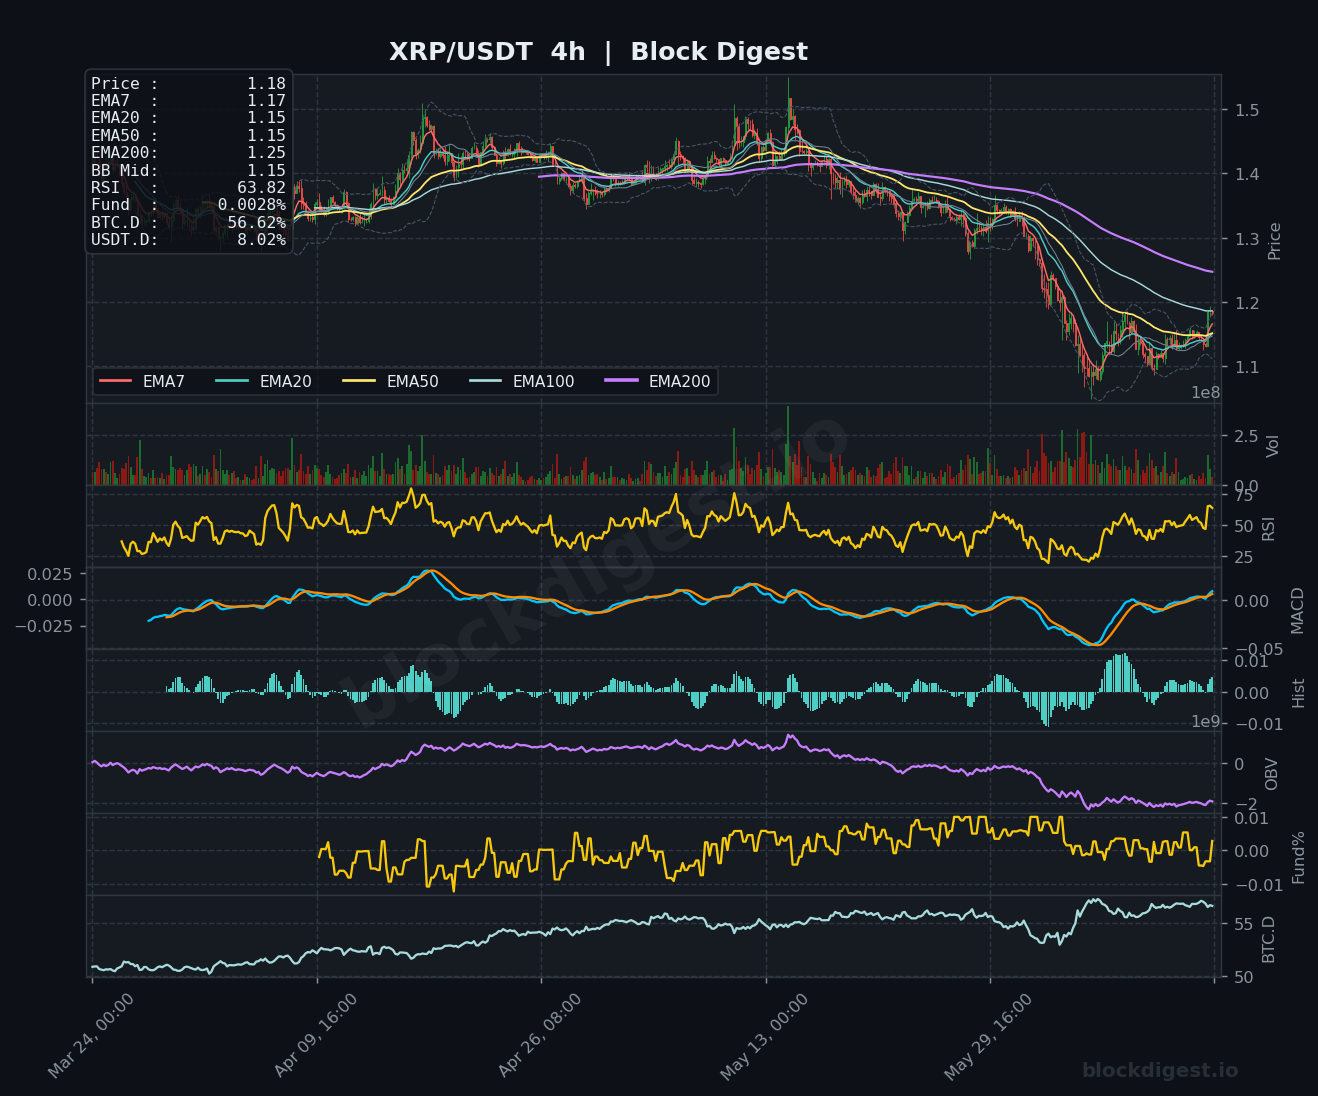
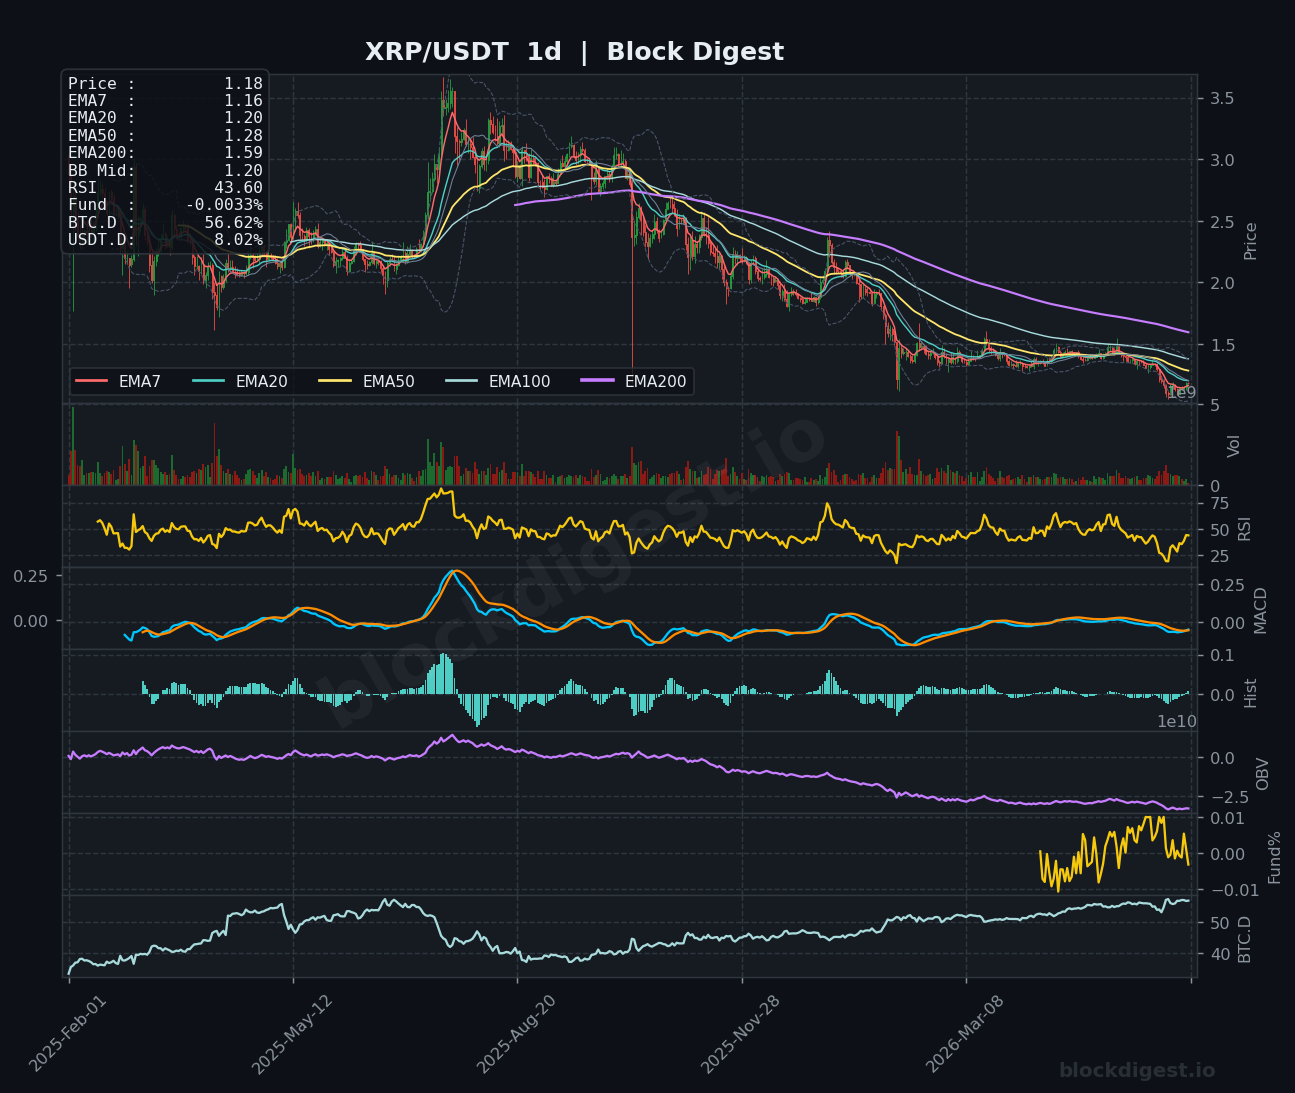
XRP is trading at $1.18, having recovered from a swing low near $1.10 but struggling to reclaim overhead EMAs on the daily timeframe, where the EMA20 sits at $1.20 and EMA50 at $1.28. The 1h RSI at 70.74 and a rising MACD histogram signal short-term bullish momentum, with price breaking back above the EMA50 ($1.15) and EMA200 ($1.15) on the hourly chart. On the 4h frame, the MACD has turned bullish from deeply negative territory, while RSI at 63.82 suggests room remains before overbought conditions. The daily RSI at 43.60 and a persistently declining OBV reflect the underlying bearish structure — the $1.20–$1.28 band will be the key test for any meaningful continuation.
BNB (BNB)
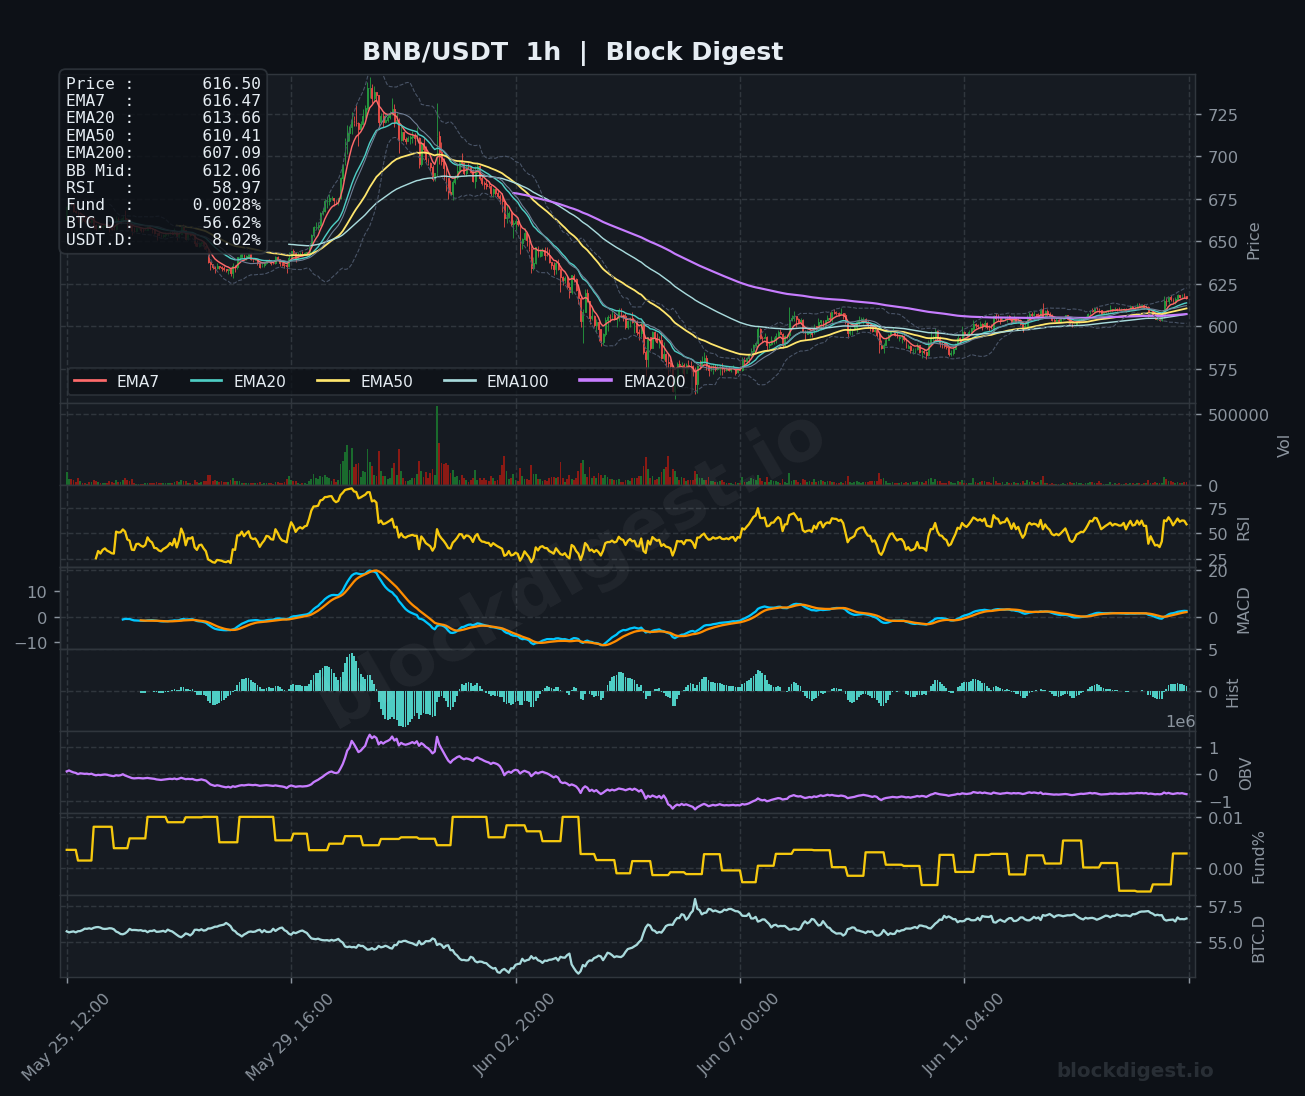
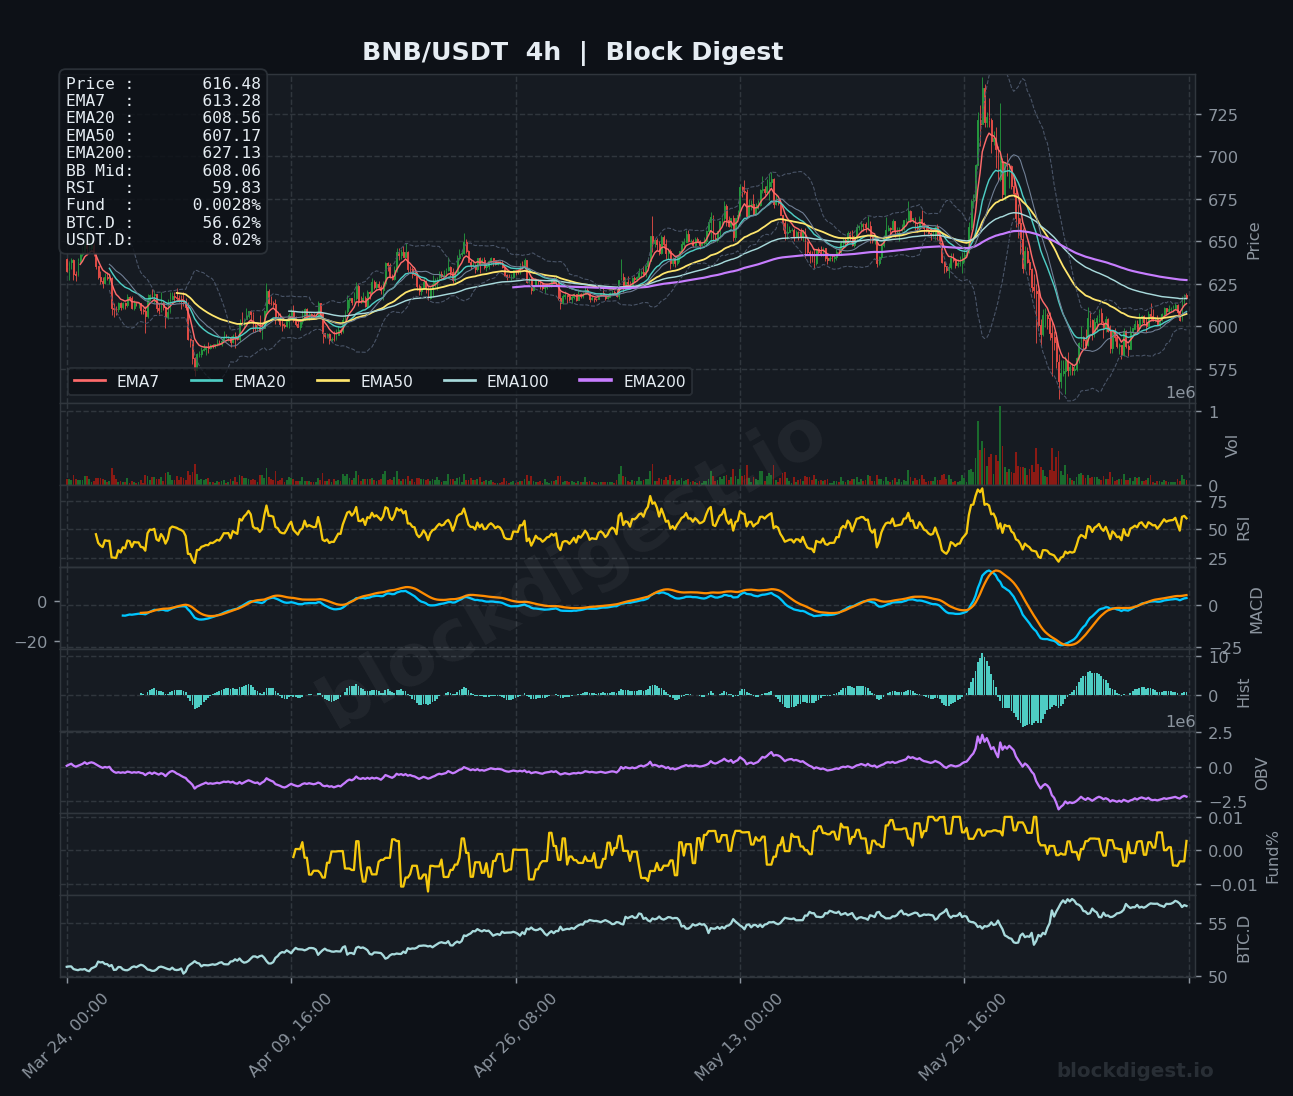
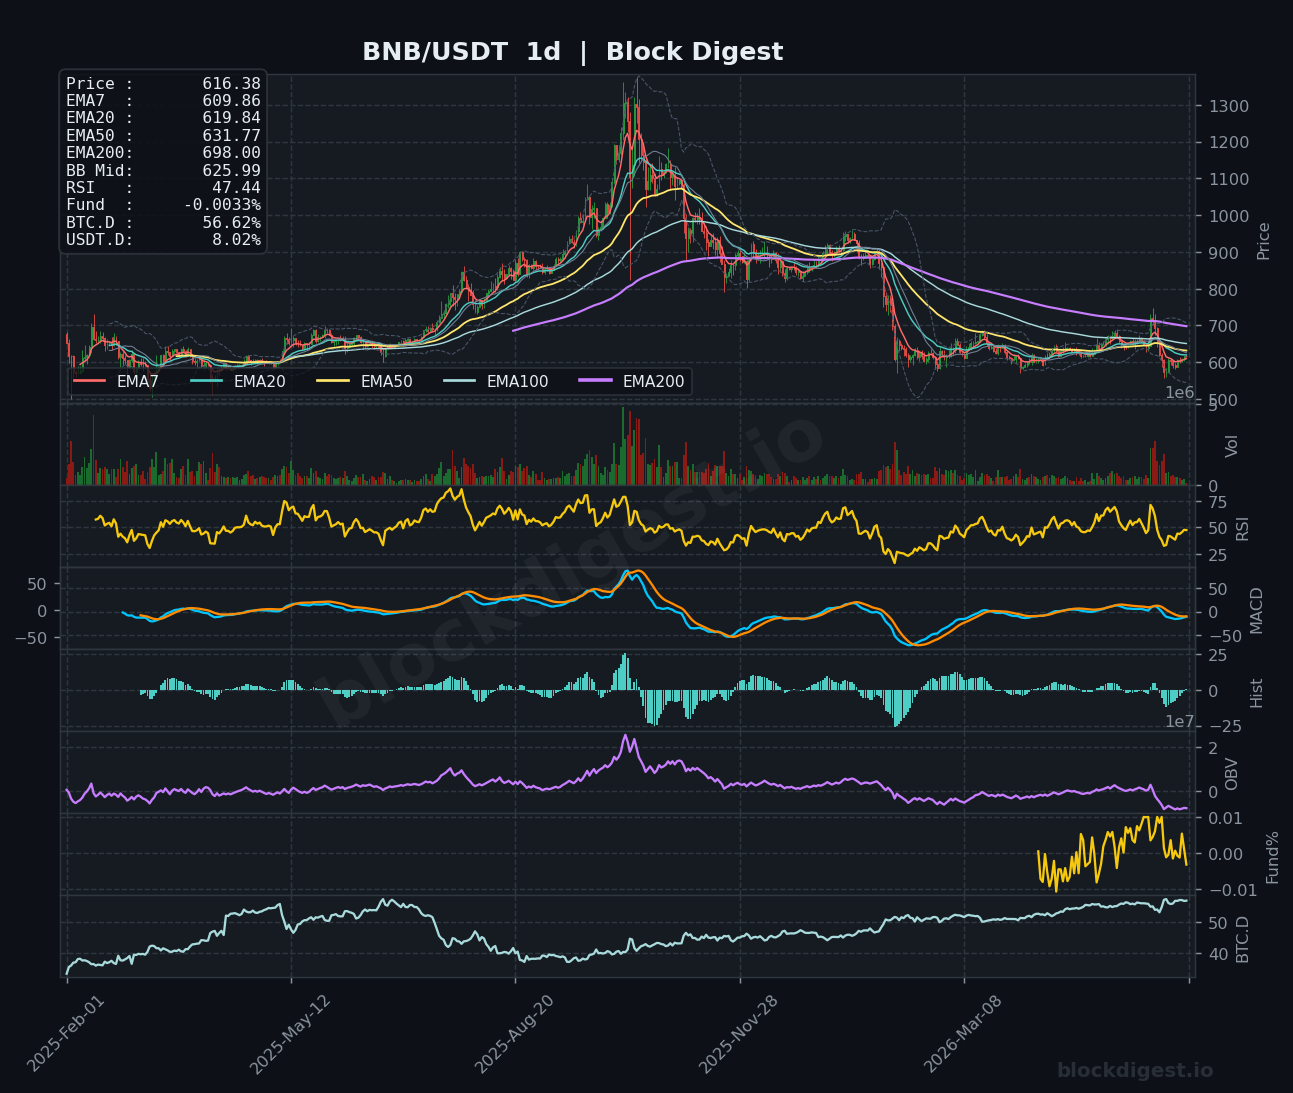
BNB is trading at $616.50, staging a recovery from lows near $575 and with the 1h chart showing price above all key short-term EMAs (EMA200 at $607.09), with RSI at 58.97 indicating healthy mid-range momentum without overextension. The 4h MACD has crossed bullish from deeply negative levels and the histogram is printing expanding green bars, reinforcing the recovery narrative. On the daily chart, however, BNB faces stiff resistance from the declining EMA20 ($619.84) and EMA50 ($631.77), with the EMA200 far above at $698.00 — the daily RSI at 47.44 reflects a market still technically below the neutral line. BNB’s near-term bias is modestly bullish, with $620–$632 as the critical resistance cluster to reclaim for conviction.
Dogecoin (DOGE)
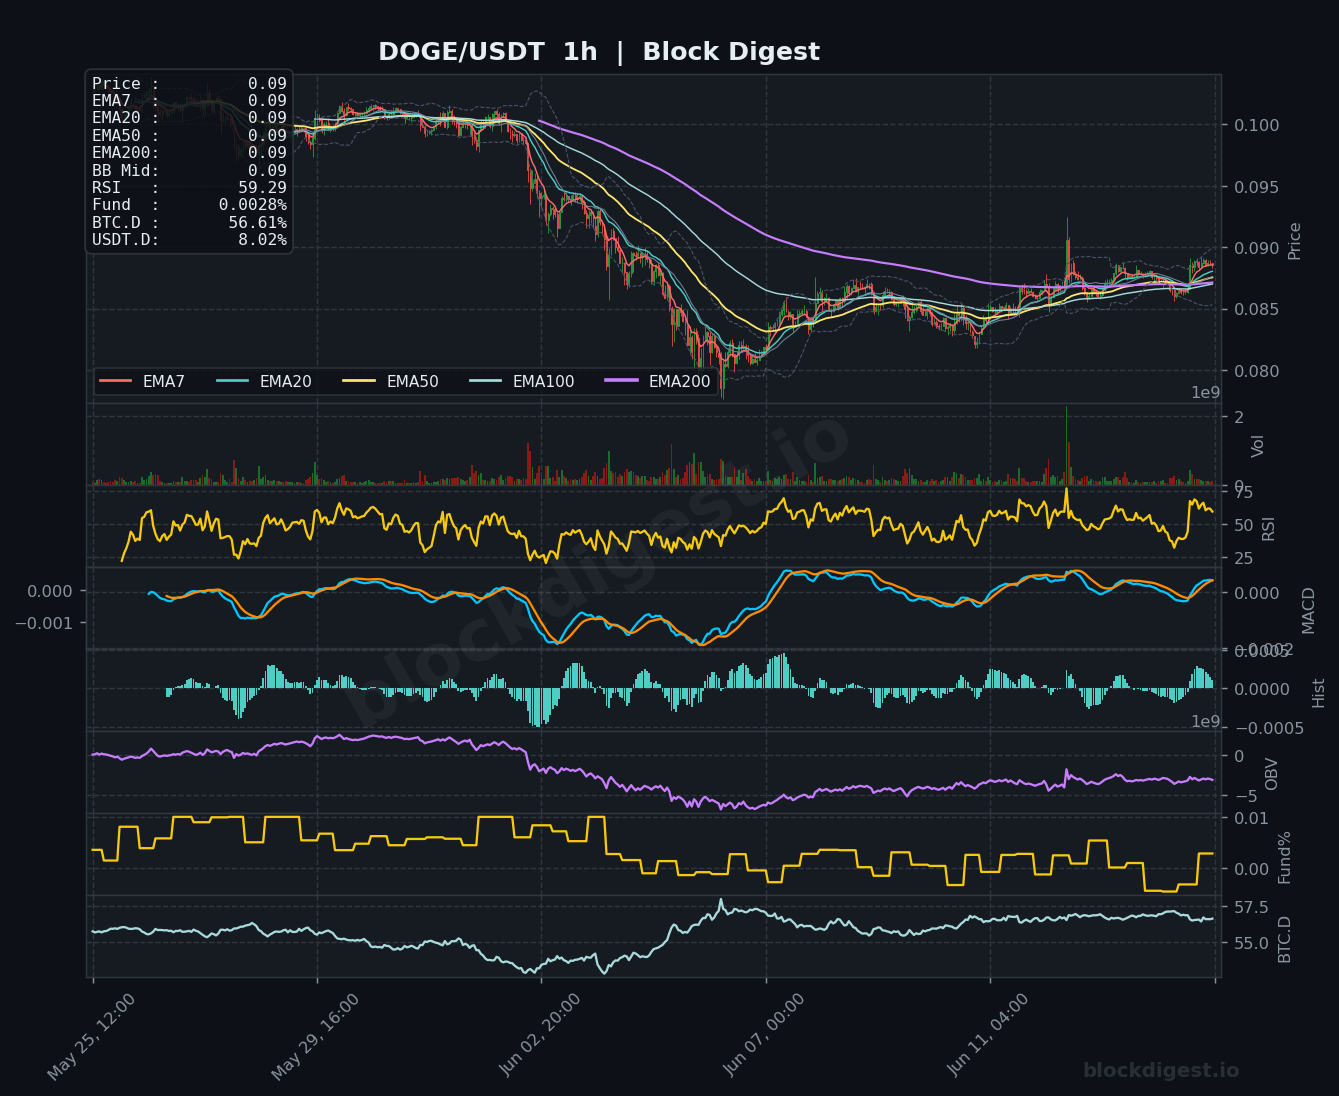
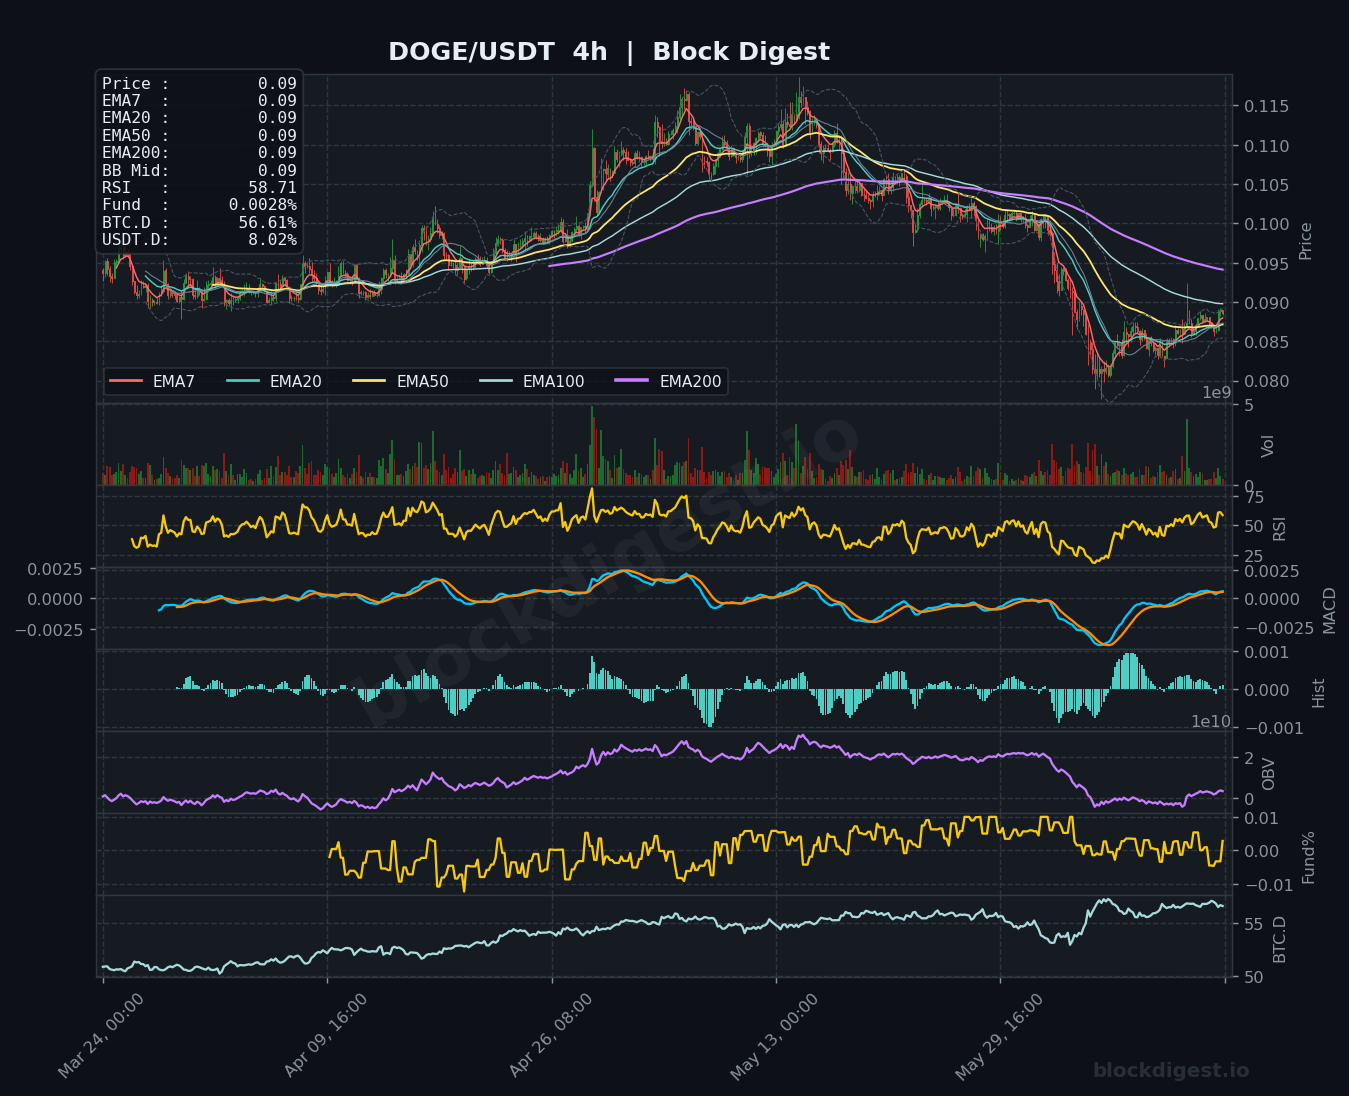
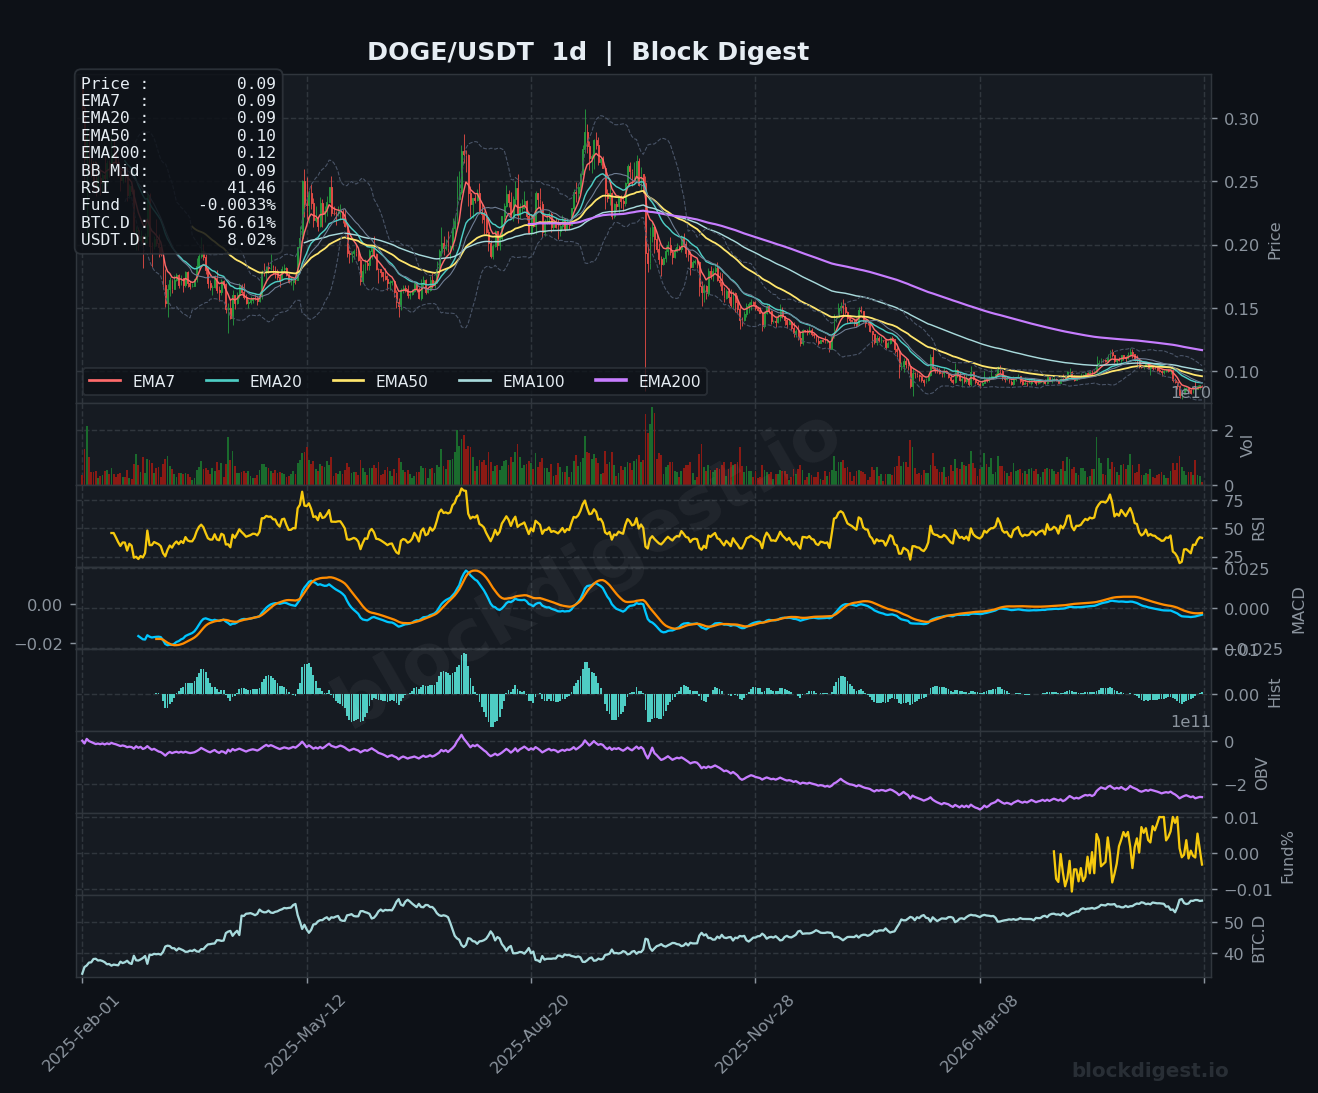
DOGE is trading at $0.09, recovering from lows near $0.080 but consolidating in a tight range as price attempts to establish support above the short-term EMA cluster around $0.088–$0.090. The 1h RSI at 59.29 and a MACD approaching the zero line suggest stabilization rather than strong momentum, while OBV on the 1h has flattened after weeks of decline. The 4h chart shows all EMAs in a bearish fan formation, with the EMA200 ($0.09) acting as a dynamic resistance level the price is now testing from below. The daily RSI at 41.46 and a deeply declining OBV confirm that DOGE remains in a structurally weak position — bias is neutral to slightly bearish with the $0.092–$0.095 zone as key overhead resistance.
Litecoin (LTC)
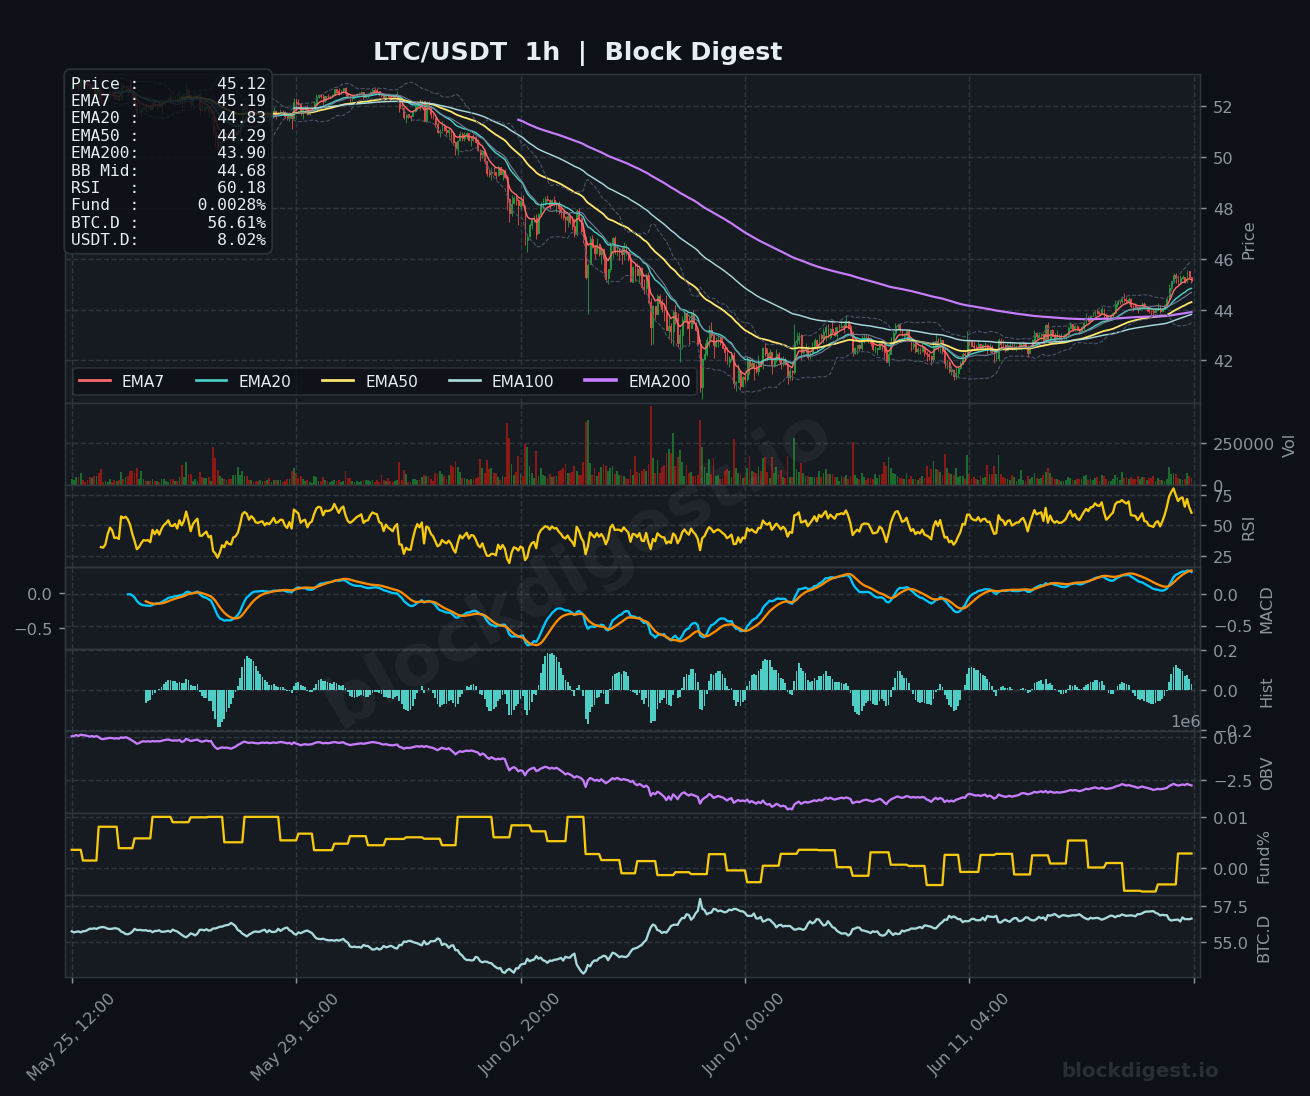
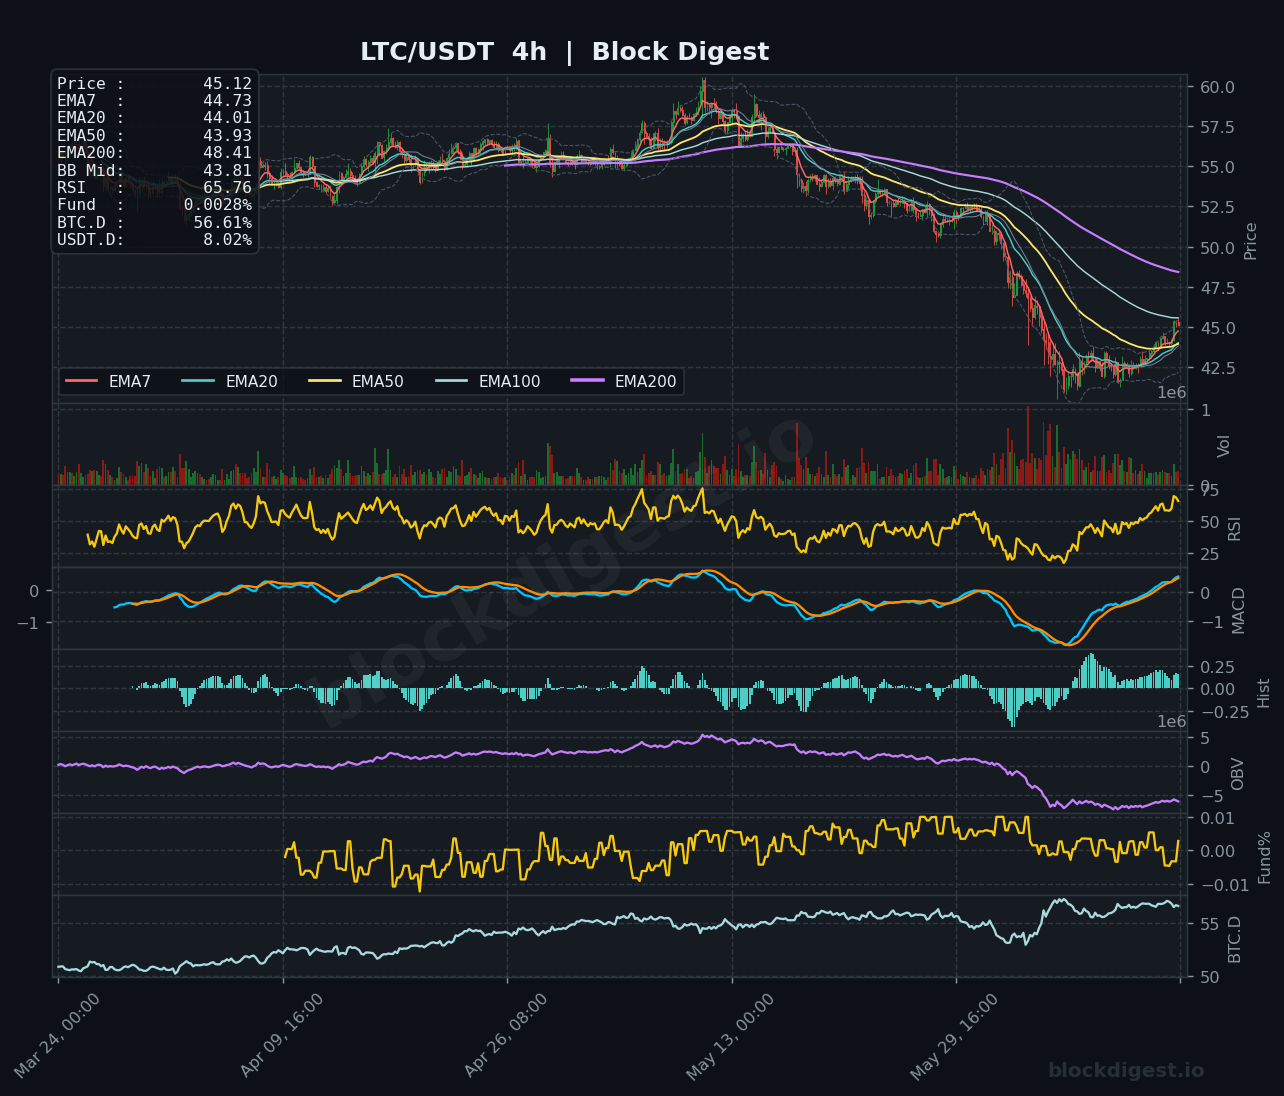
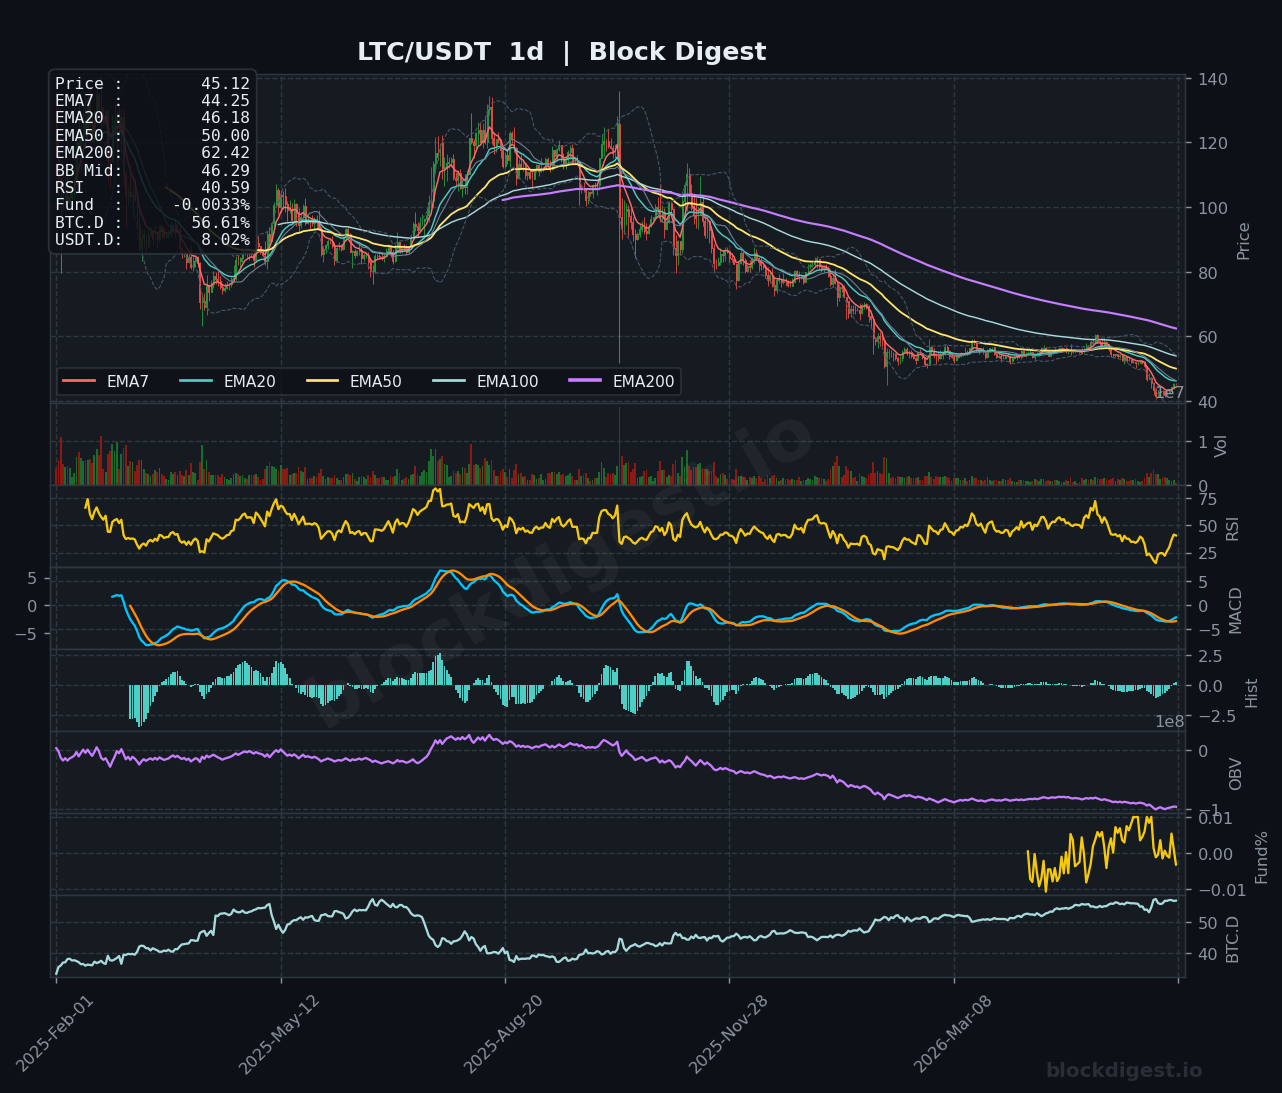
LTC is trading at $45.12, posting one of the stronger short-term recoveries in this cohort, with price now trading above all 1h EMAs (EMA7: $45.19, EMA20: $44.83, EMA50: $44.29, EMA200: $43.90) and the 1h RSI at 60.18. The 4h MACD has crossed bullish with growing histogram bars, and the 4h RSI at 65.76 shows strengthening momentum that still has room before reaching overbought levels. On the daily frame, LTC faces the $46.18 EMA20 and $50.00 EMA50 as immediate resistance, with RSI at 40.59 and OBV continuing to trend lower — confirming the broader downtrend remains intact. Short-term bias is cautiously bullish given the clean EMA alignment on lower timeframes, but the $46–$50 zone will determine whether this is a relief bounce or the start of something more meaningful.
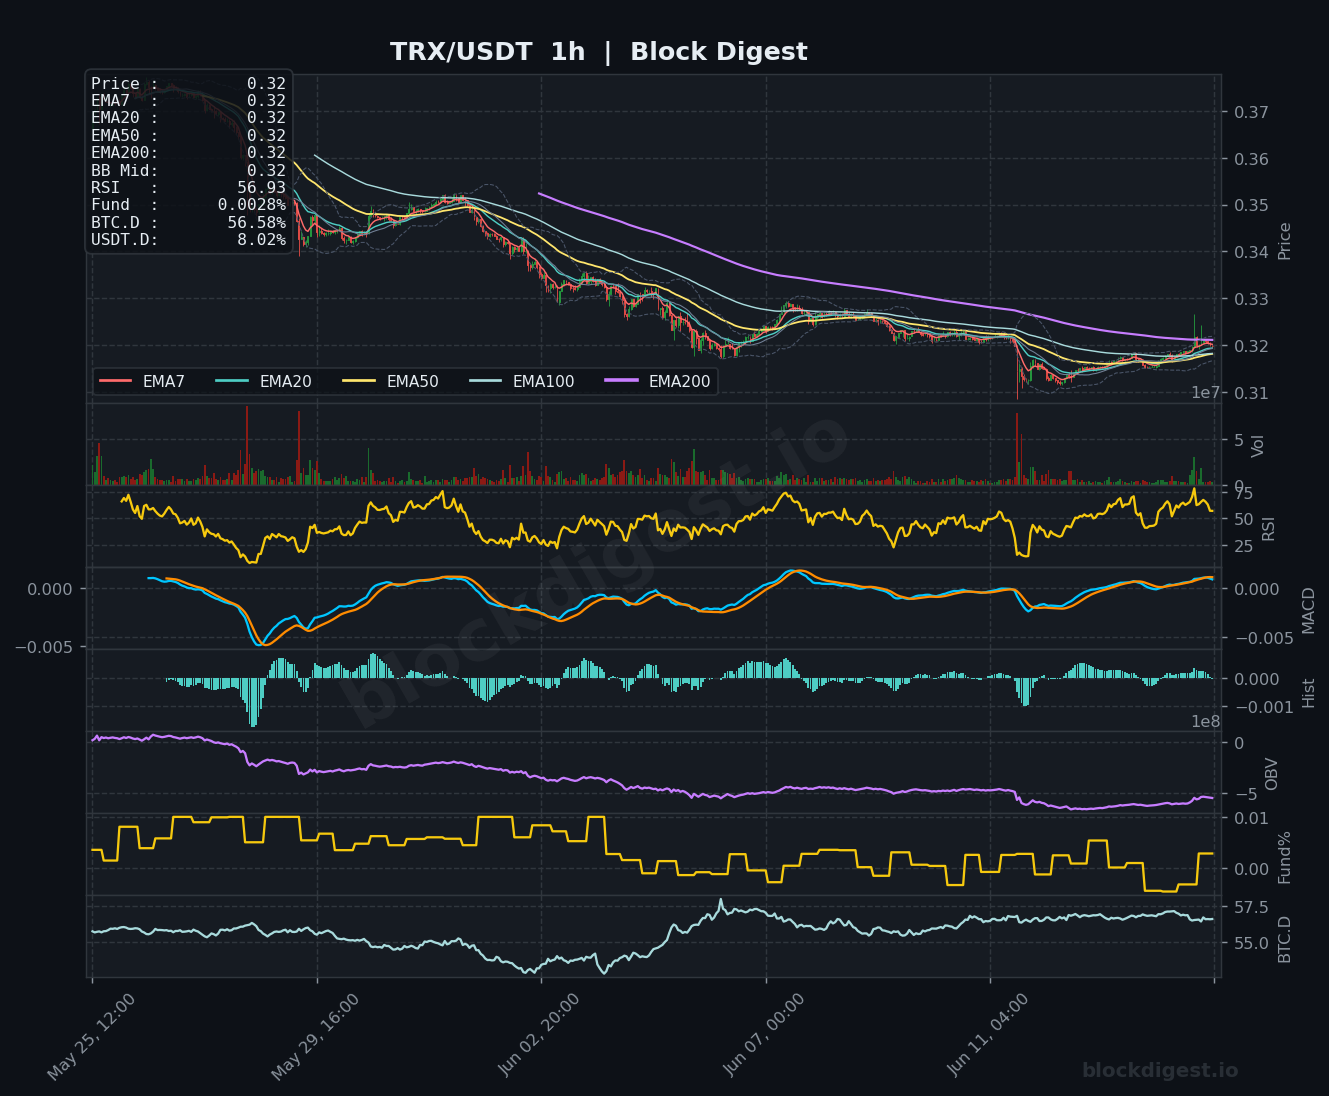
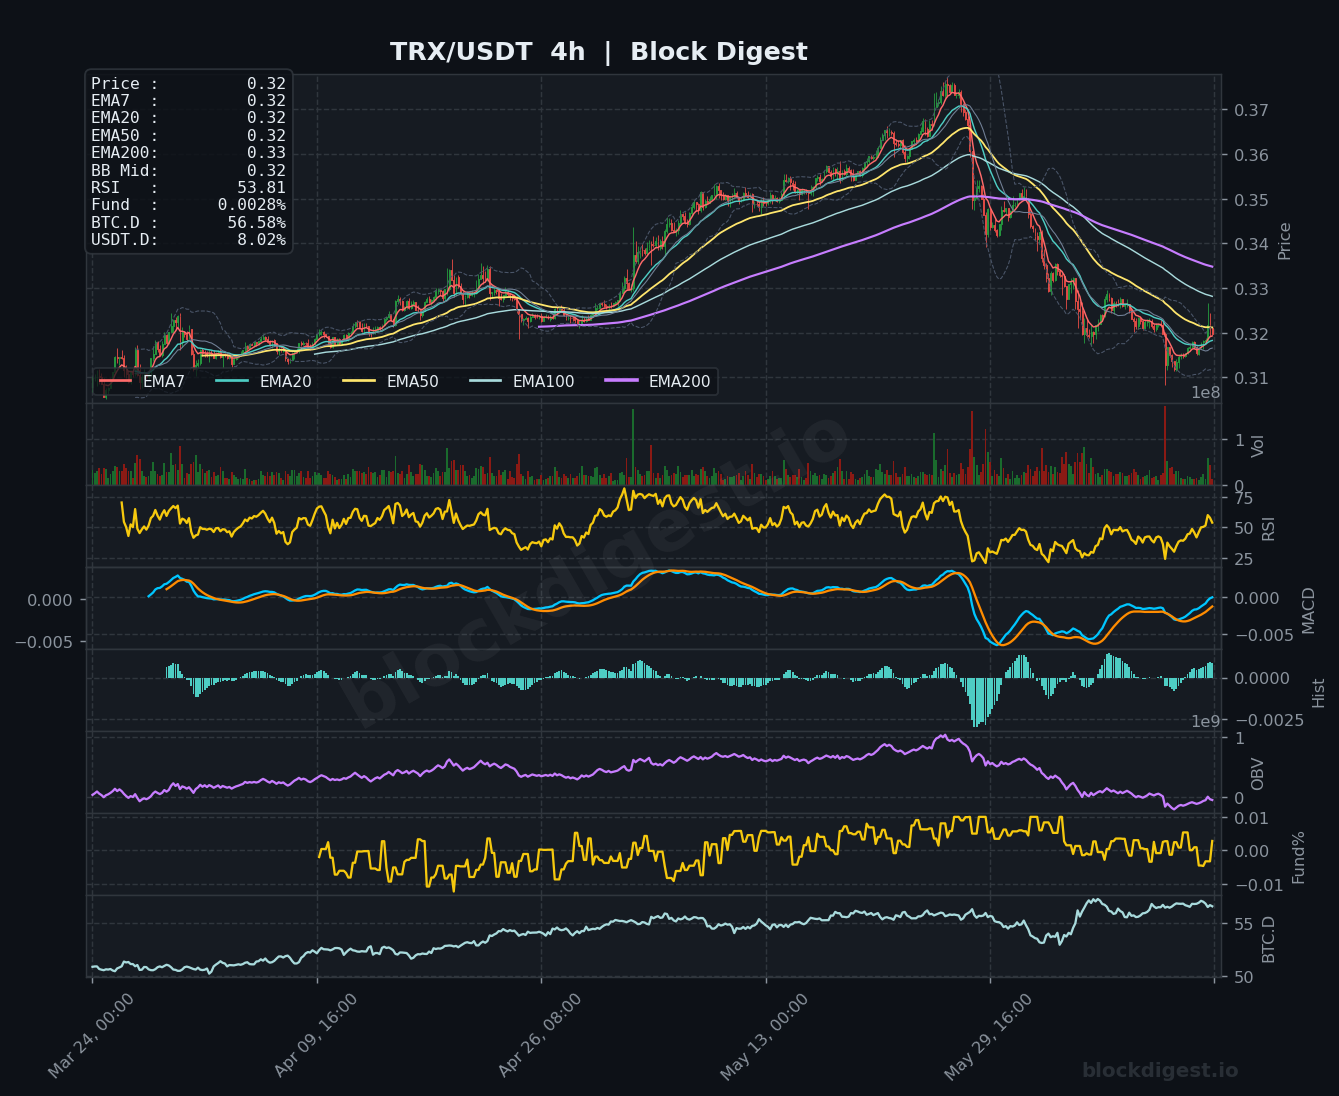
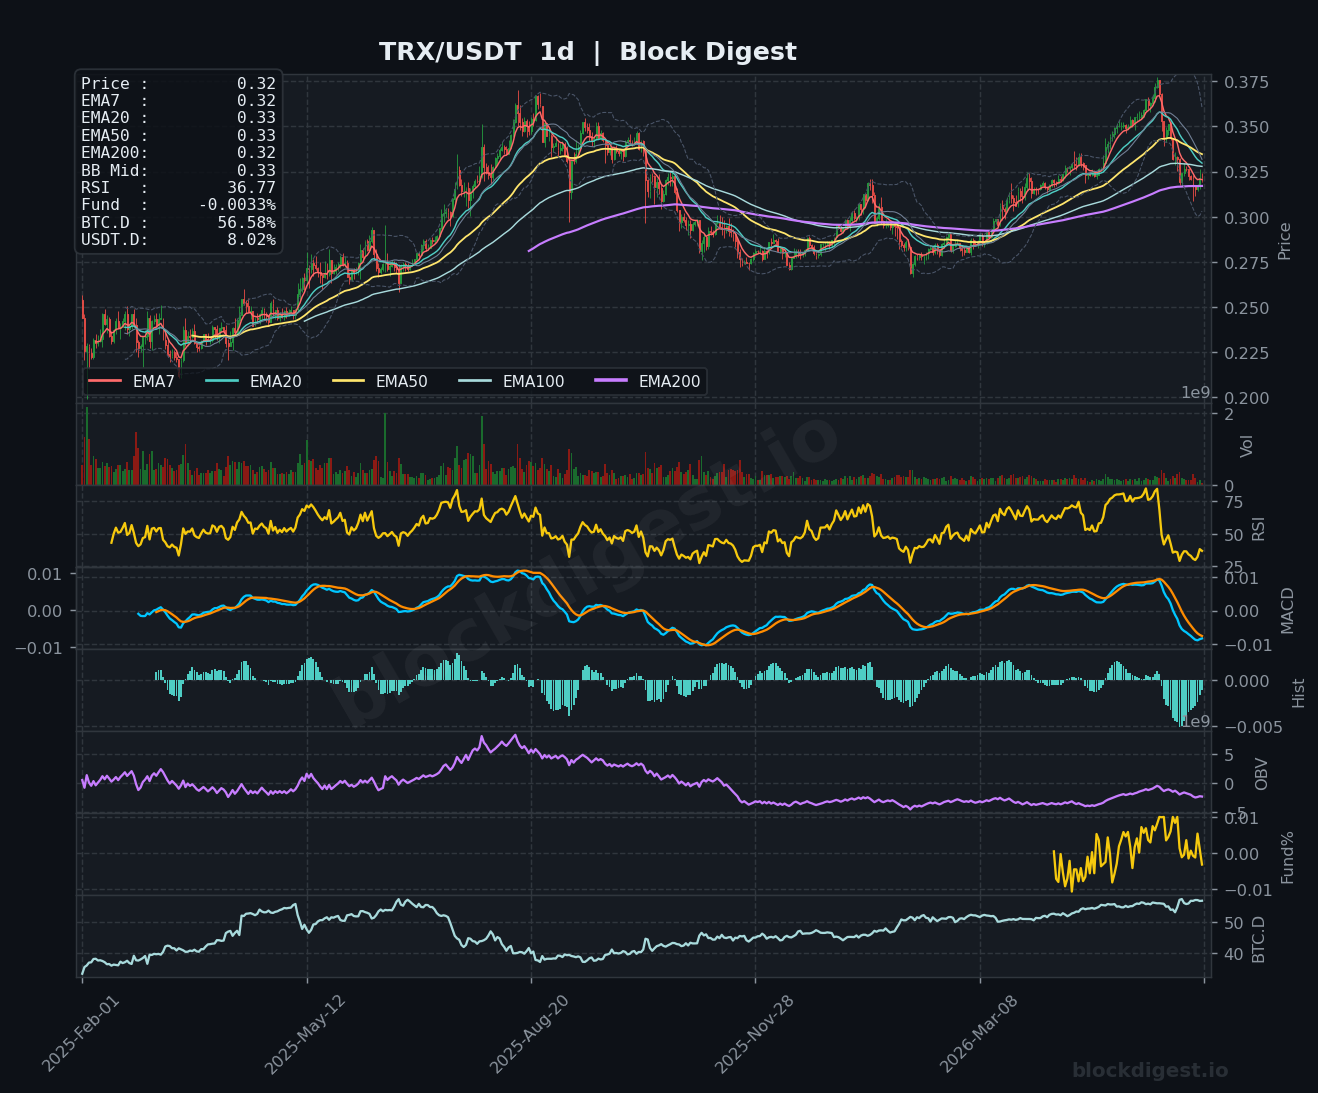
TRON (TRX)
TRX is trading at $0.32, attempting to stabilize after a sharp correction from its recent highs near $0.375, with price consolidating near the EMA cluster on the 1h chart (all EMAs converging at $0.32). The 1h RSI at 56.93 and a MACD near the zero line suggest indecision, while OBV on the 1h continues its steady decline — pointing to persistent selling pressure beneath the surface. The 4h MACD remains in negative territory though recovering, with RSI at 53.81 indicating the bounce lacks conviction. Most notably, the daily RSI has dropped to 36.77 — approaching oversold territory — and price is now testing the EMA200 ($0.32) from above after a prolonged period of outperformance; this level holds structural significance and a break below could accelerate losses toward $0.29–$0.30 support.
Altcoin Outlook
The June 15 altcoin landscape is characterized by broad recovery attempts off recent lows, but the rallies lack the volume and macro confirmation needed to signal a definitive trend reversal. LTC and BNB present the relatively cleaner short-term setups, with both showing bullish EMA alignment on lower timeframes and improving MACD momentum, while DOGE and TRX display the weakest structures — particularly on the daily — with declining OBV and RSI readings that reflect sustained distribution. The key watch conditions for the coming sessions are BTC dominance — a continued rise above 57% would likely cap altcoin upside — and whether USDT.D begins to roll over meaningfully, which would be the clearest signal that risk appetite is returning in earnest. Until daily-timeframe MACD and OBV across this group begin to confirm the short-term bounces, traders should treat current moves as potential dead-cat relief rallies within broader corrective structures.
Disclaimer: This analysis is for informational purposes only and does not constitute financial advice. Cryptocurrency markets are highly volatile and unpredictable. All trading decisions should be made based on your own research and risk tolerance. Block Digest is not responsible for any financial losses incurred as a result of acting on this content.