Altcoin Daily Analysis: BTC Dominance at 53.88% Suppresses Altcoin Participation
Market Context
The altcoin market is under notable pressure as of June 4, 2026, with BTC dominance sitting at 53.88% — a level that continues to suppress broad altcoin participation and signals capital consolidation into Bitcoin rather than rotation into risk assets. USDT dominance at 8.14% reflects a meaningful portion of sidelined capital, suggesting investors remain cautious and have not yet committed to a sustained altcoin recovery. The overall risk appetite across the altcoin space appears weak, with most major alts trading well below key moving averages and momentum indicators deep in bearish territory across multiple timeframes.
Solana (SOL)
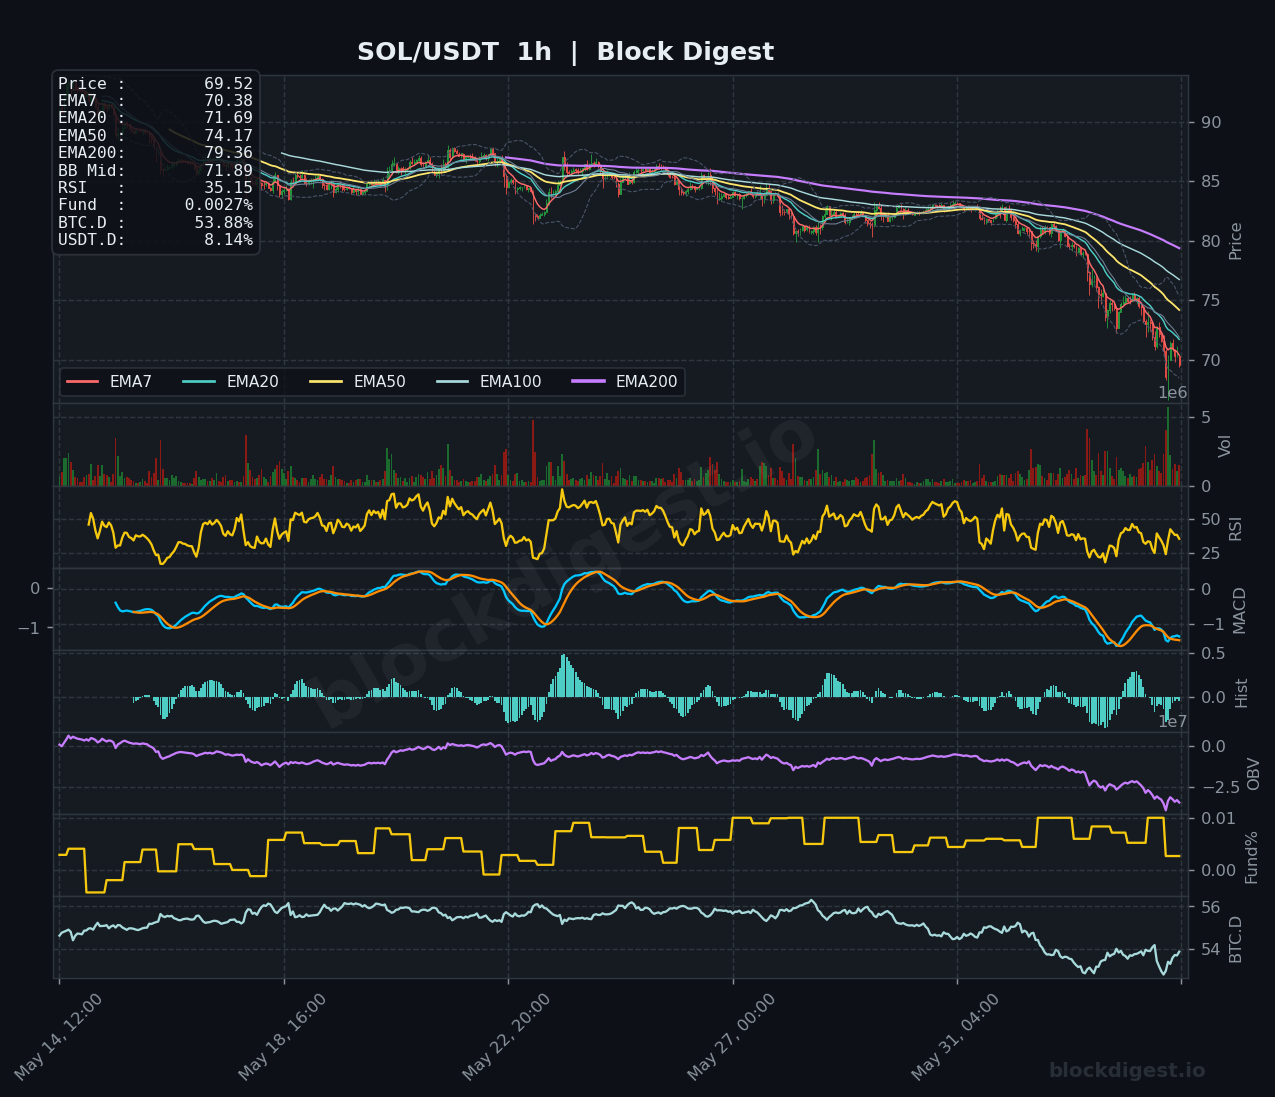
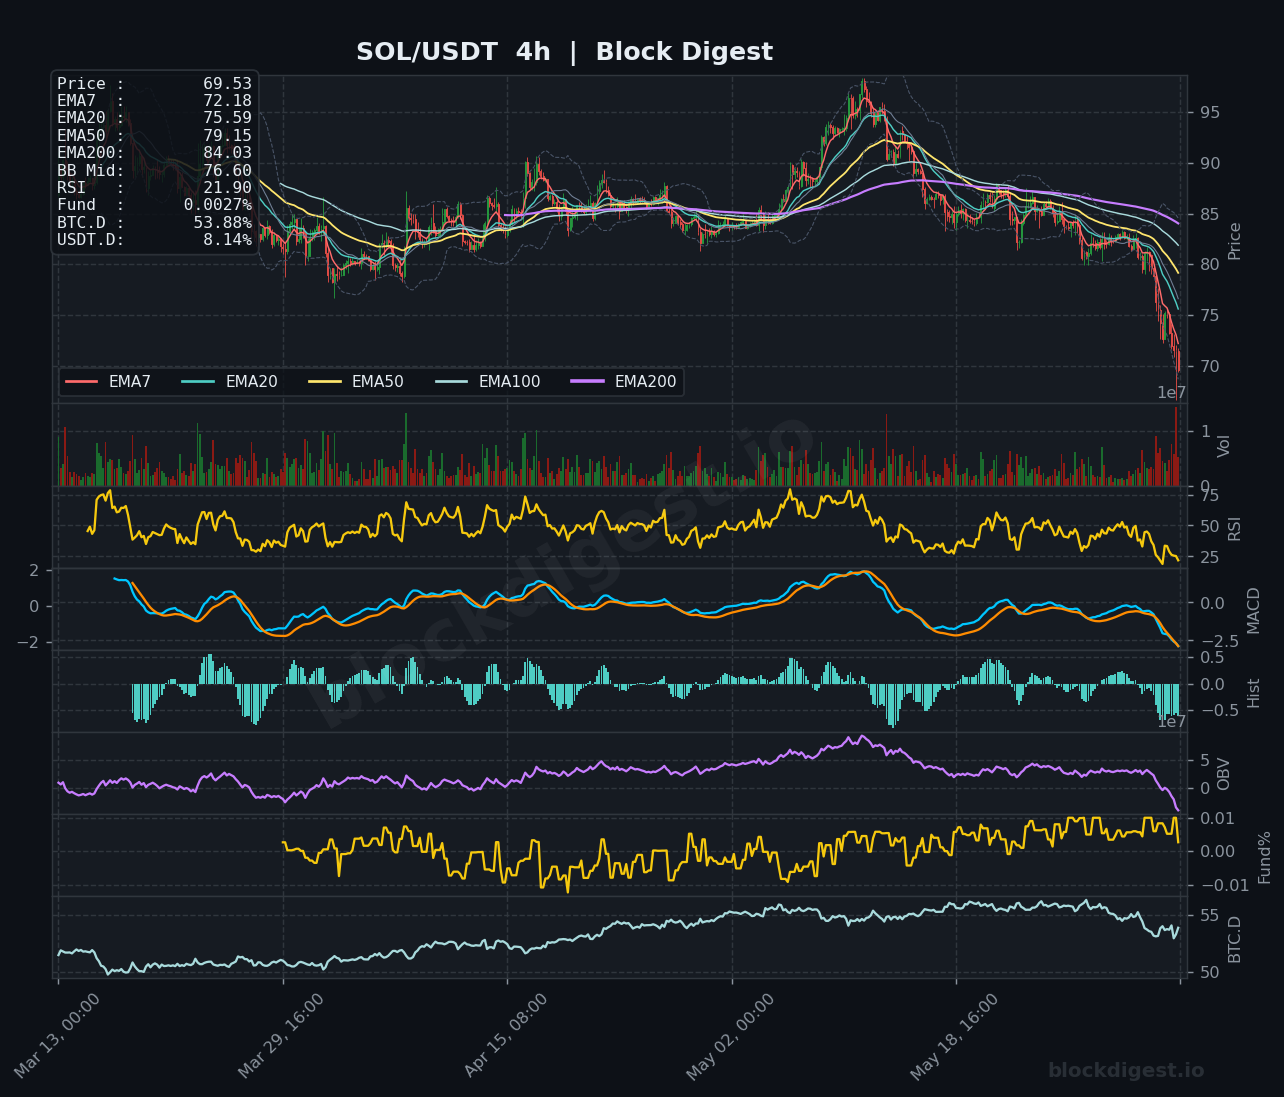
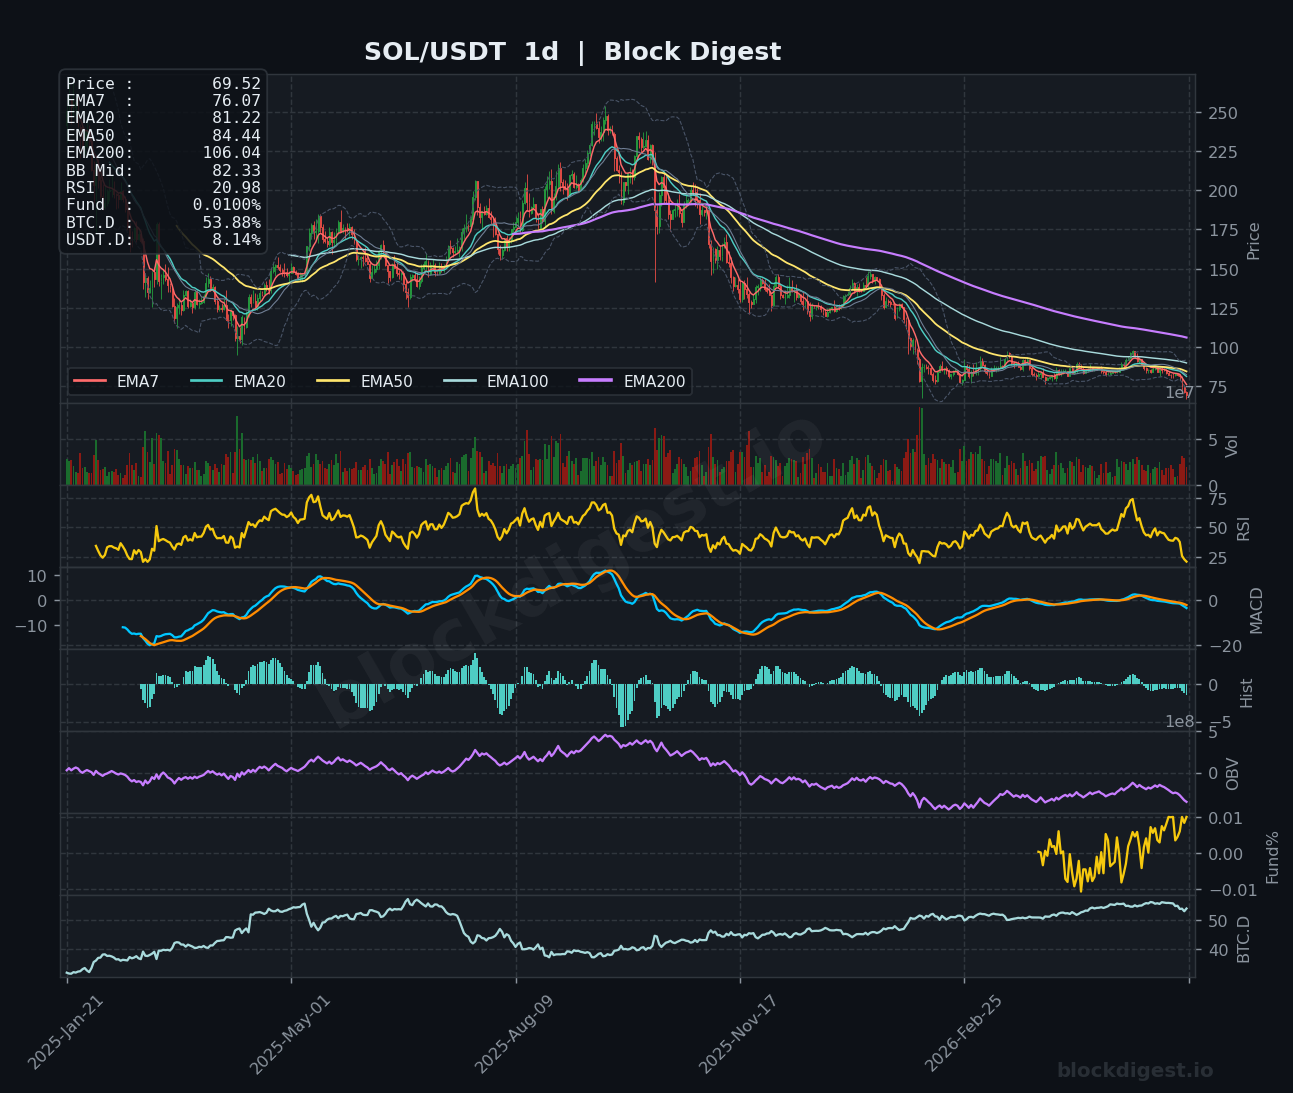
SOL is trading at $69.52, having suffered a significant breakdown from the $90+ range, with price now trading below all major EMAs — the EMA7 at $70.38, EMA20 at $71.69, EMA50 at $79.15, and EMA200 at $84.03 on the 4h chart — confirming a deeply bearish structure across timeframes. The daily RSI has collapsed to 20.98, placing SOL in oversold territory on the 1d chart, while the 4h RSI at 21.90 echoes the same extreme reading, suggesting exhaustion may be near but no reversal signal has yet materialized. MACD on both the 4h and daily remains in a firm bearish crossover with expanding negative histogram bars, and the declining OBV confirms sustained distribution. The short-term bias remains bearish, with $65–$67 as the next structural support zone to monitor; any bounce will face heavy resistance from the cluster of EMAs between $72 and $80.
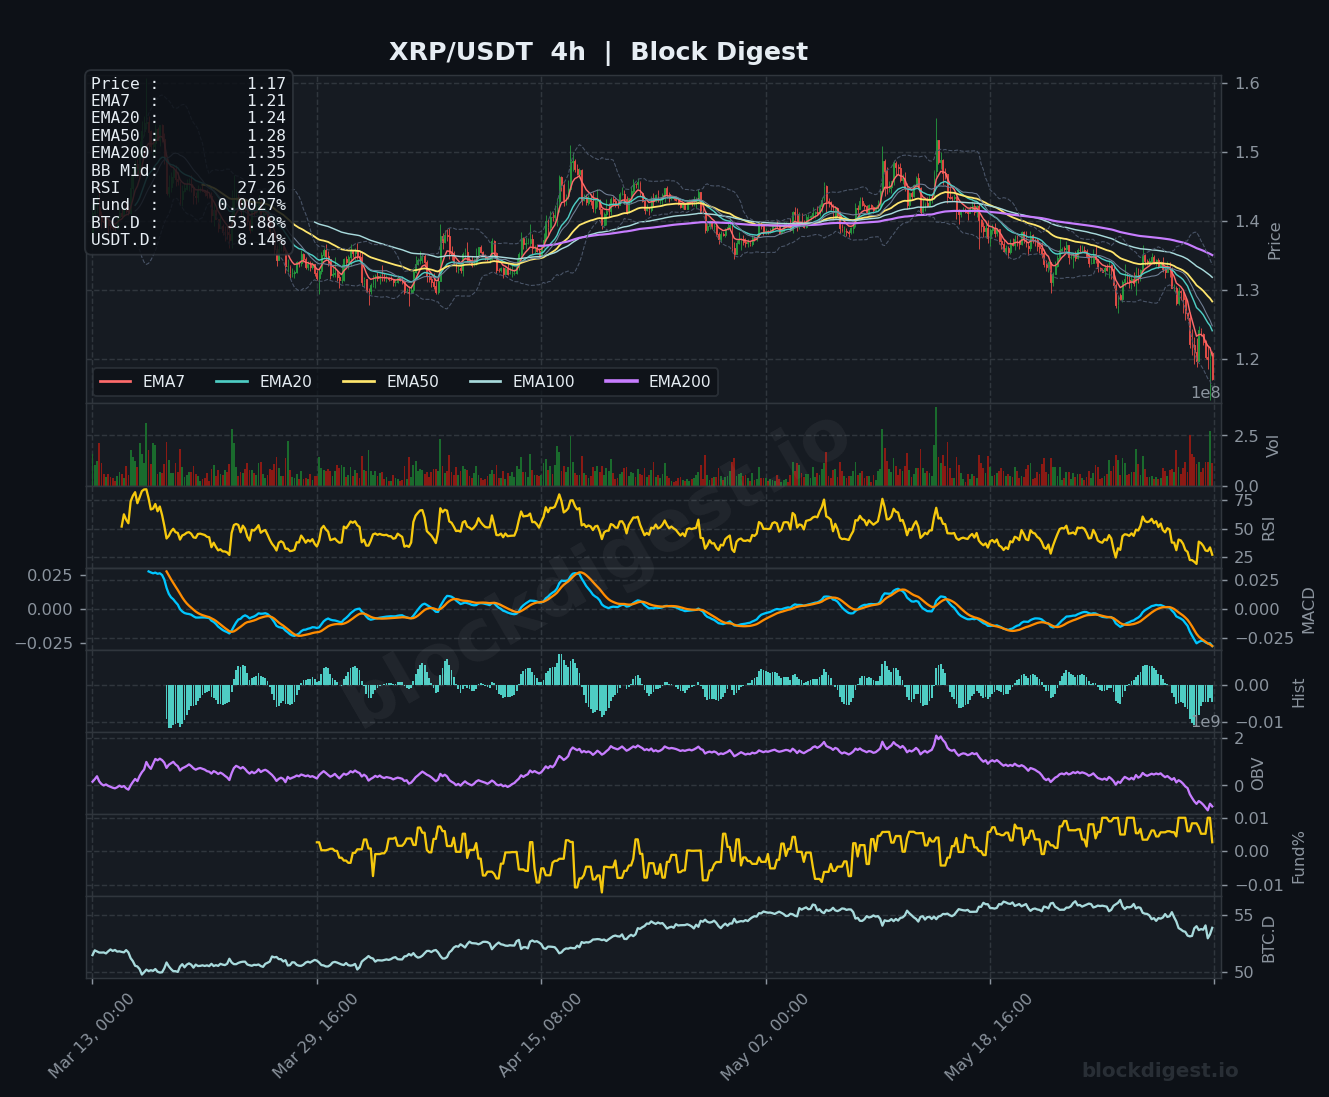
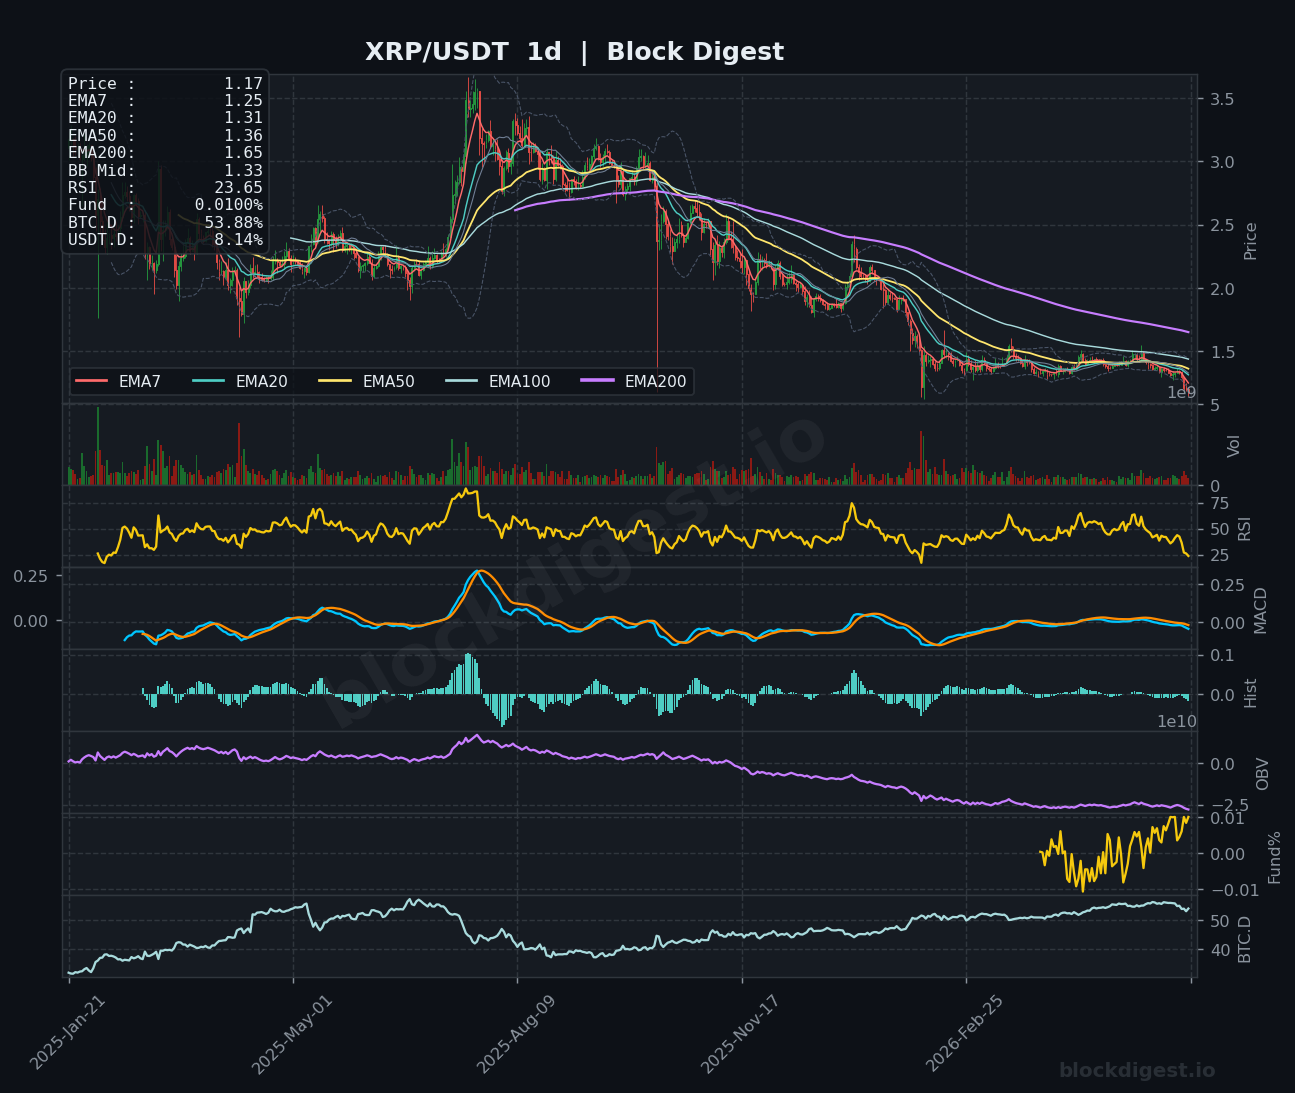
XRP (XRP)
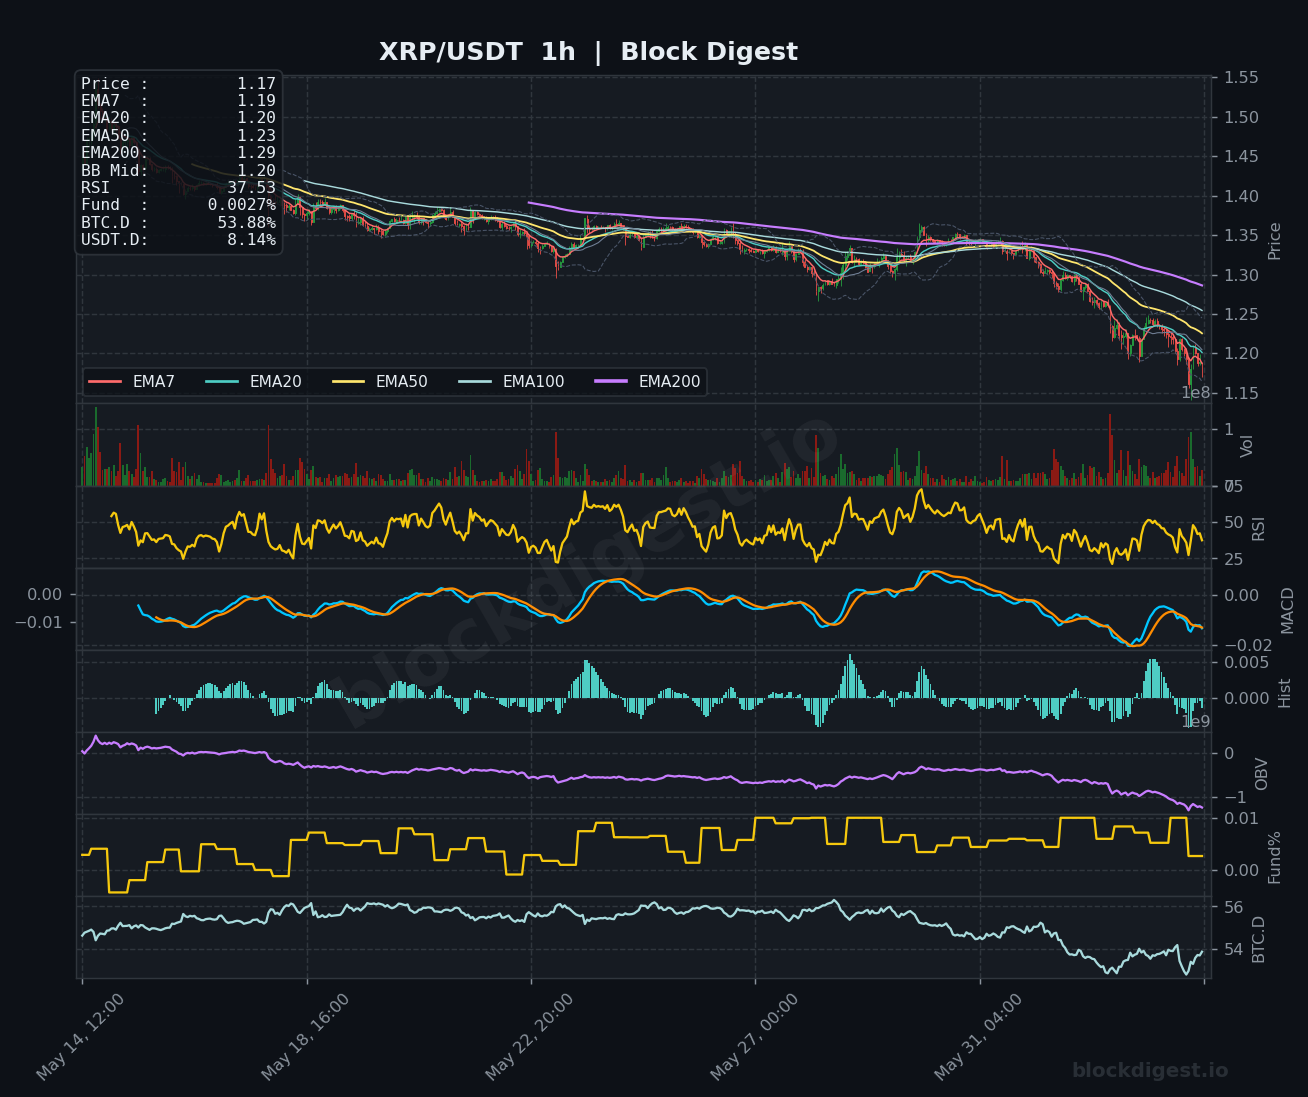
XRP is trading at $1.17, extending a prolonged downtrend from its highs above $3.00 seen on the daily chart, with price currently printing below all key EMAs — EMA7 at $1.25, EMA20 at $1.31, EMA50 at $1.36, and the EMA200 far above at $1.65. The 4h RSI at 27.26 and the daily RSI at 23.65 both signal deeply oversold conditions, though the absence of any bullish divergence or MACD hook on the higher timeframe limits the conviction of an imminent recovery. The 1h MACD remains in bearish cross territory with the signal line still diverging to the downside, and the OBV trend across all timeframes continues to slope lower, reflecting persistent sell-side pressure. Immediate support is seen around $1.10–$1.15, while a reclaim of $1.25–$1.30 would be the minimum requirement to shift near-term sentiment to neutral.
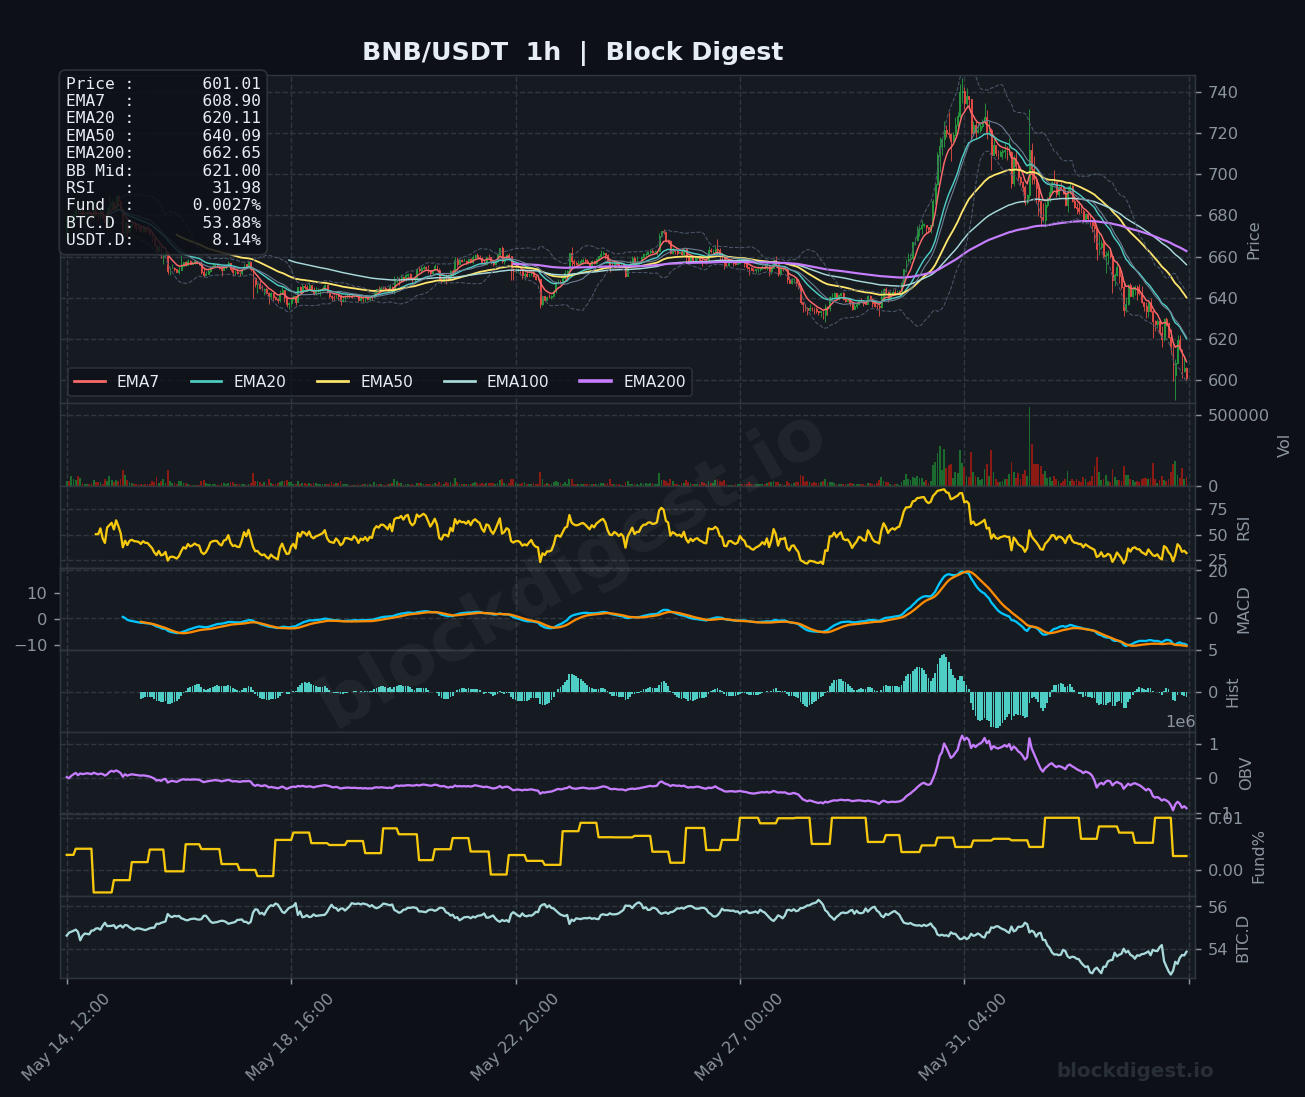
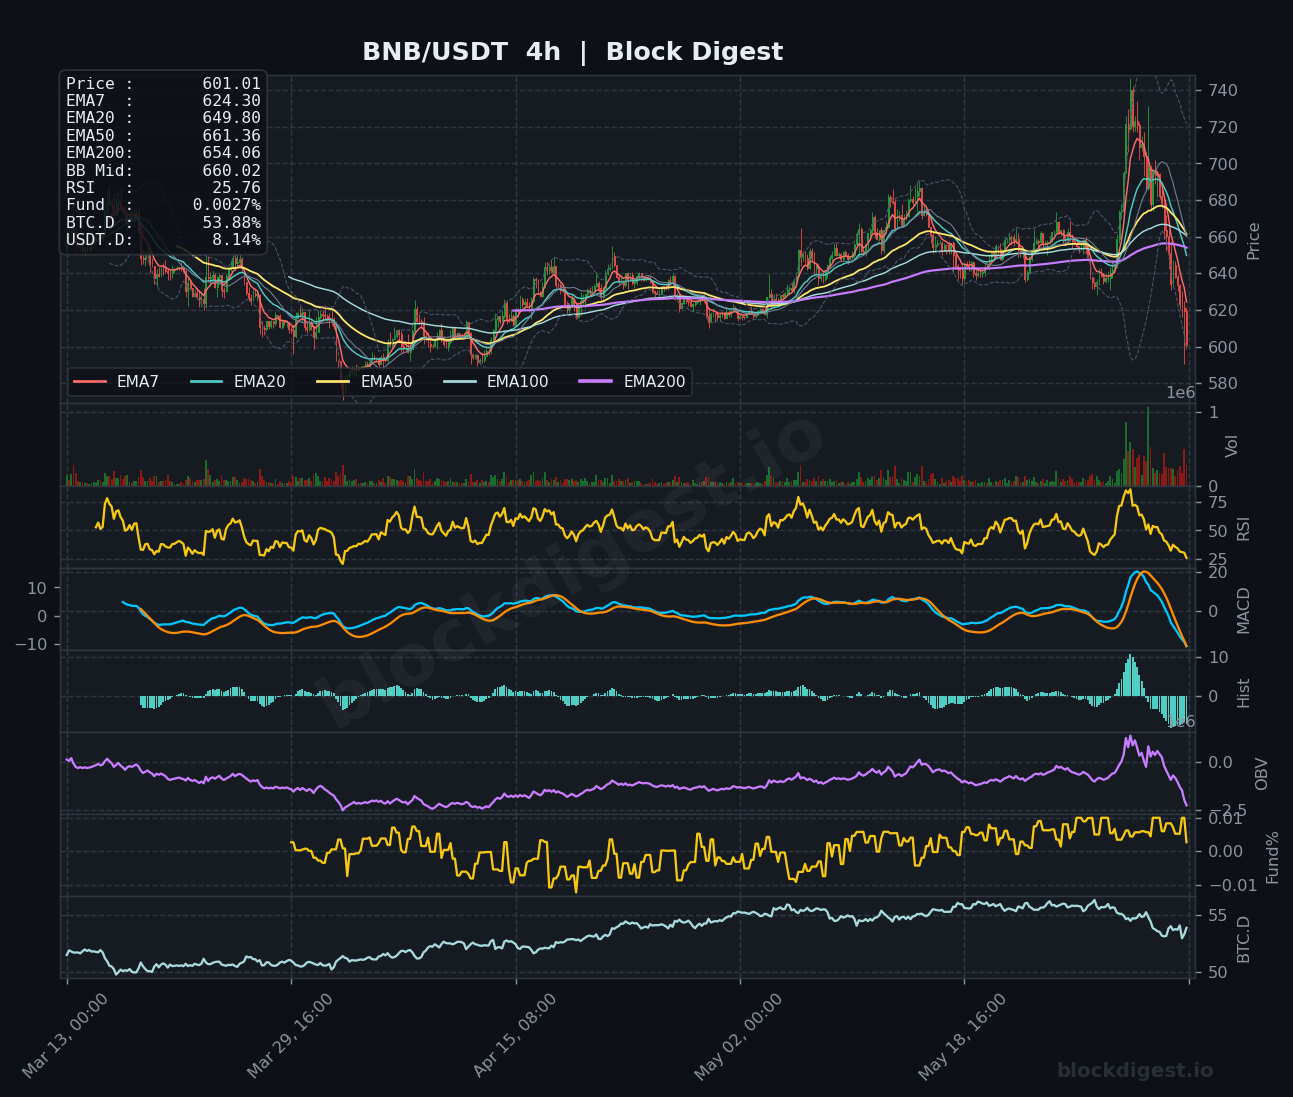
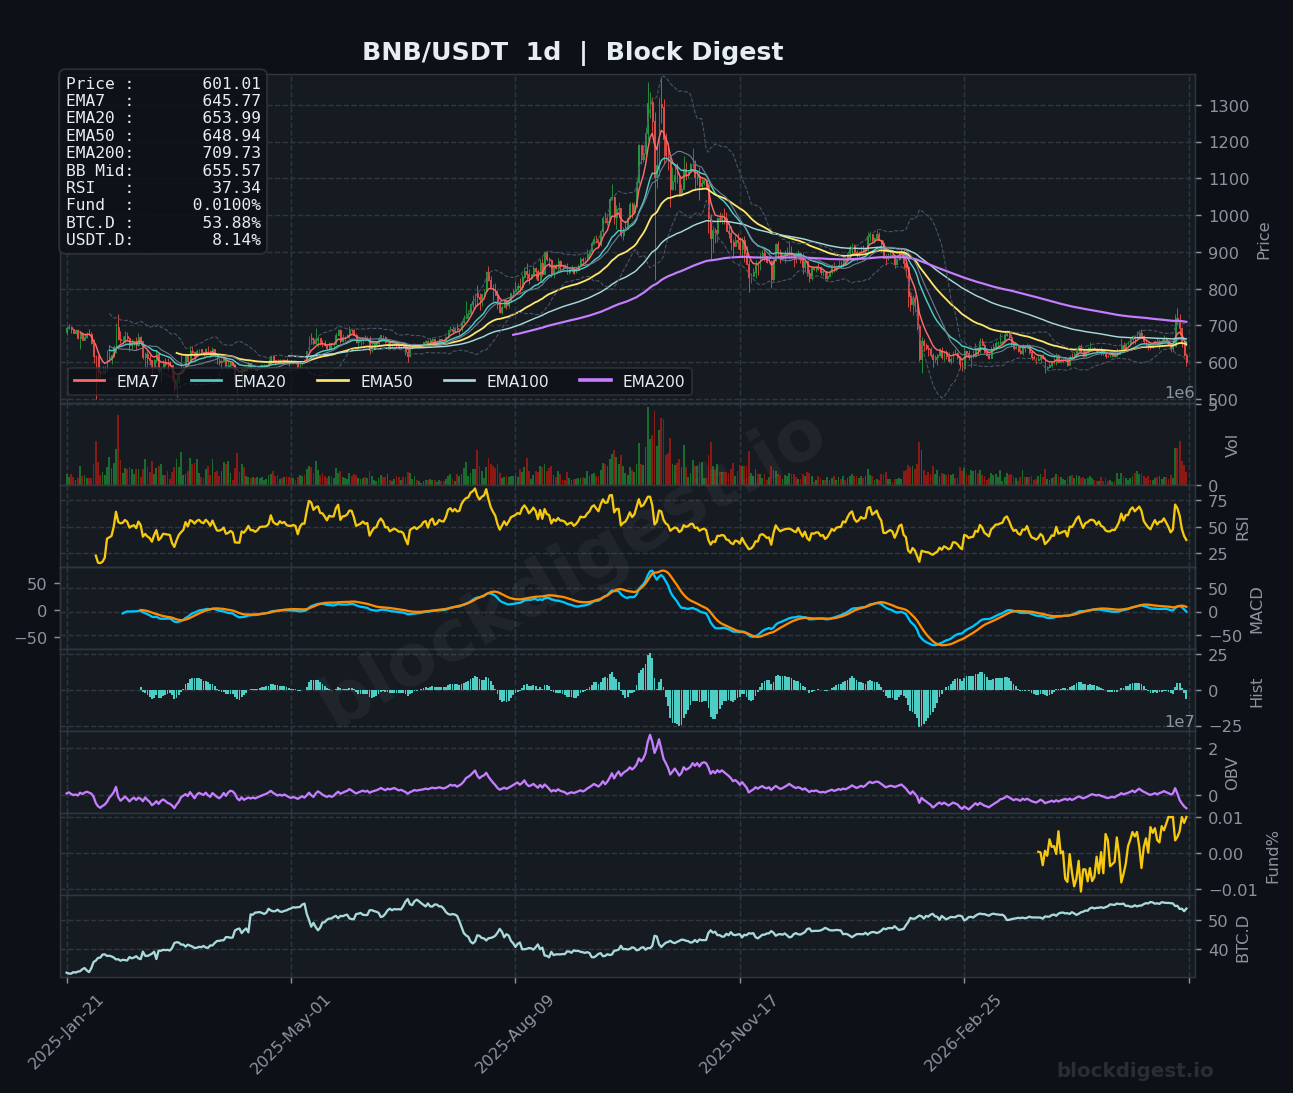
BNB (BNB)
BNB is currently trading at $601.01, having experienced a sharp reversal from a recent spike toward $740, with price now back below the EMA7 ($624.30), EMA20 ($649.80), and EMA50 ($661.36) on the 4h chart, indicating the rally was a liquidity event rather than a structural trend shift. The 4h RSI has plunged to 25.76 and the 1h RSI sits at 31.98, both signaling oversold conditions in the short to medium term; however, the MACD on the 4h has made a sharp bearish cross following the spike reversal, with the histogram printing significant negative bars. On the daily chart, RSI has pulled back to 37.34, still above the extreme oversold levels seen in peers, suggesting BNB retains relatively more structural support — with the daily EMA200 at $709.73 now acting as distant overhead resistance. Key support lies around $580–$590, while bulls would need a sustained recovery above $640–$650 to negate the current bearish momentum.
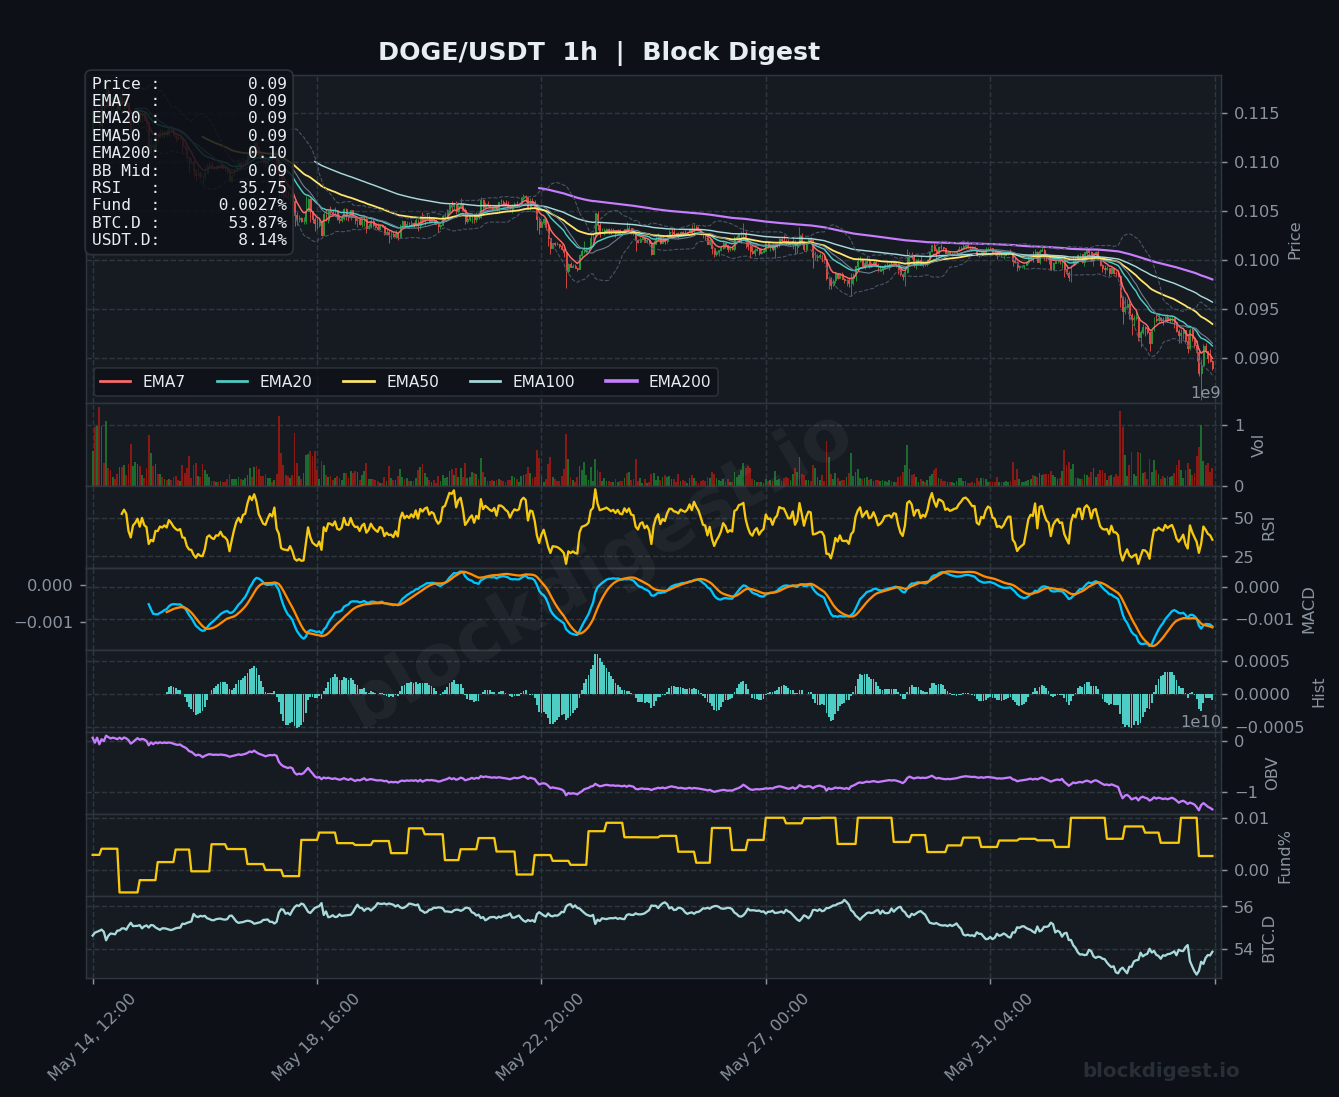
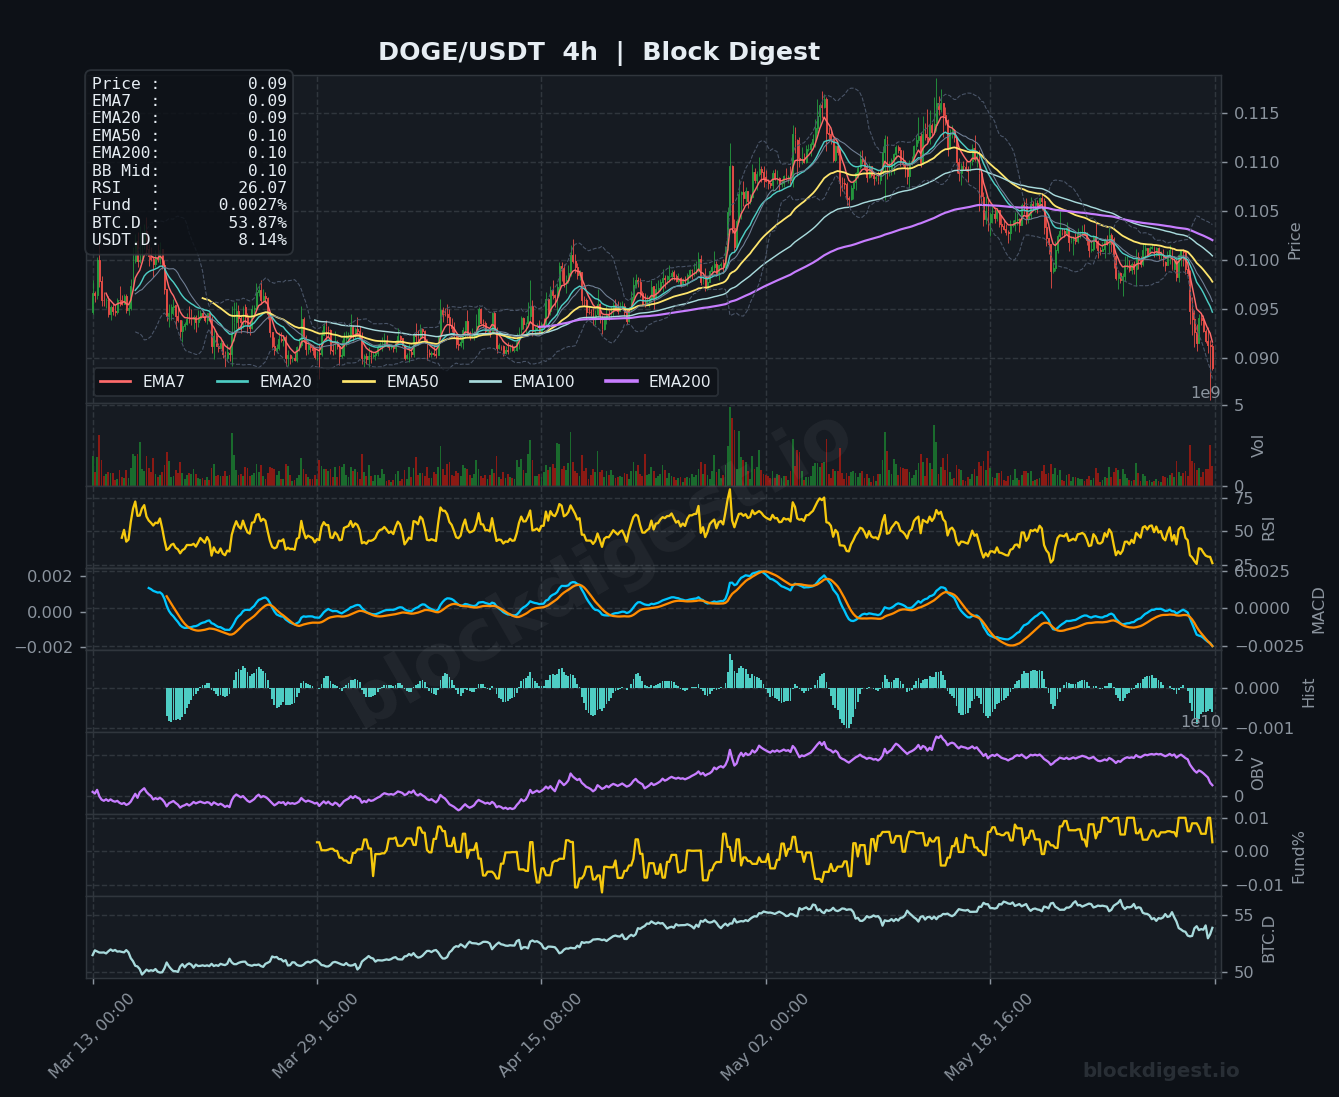
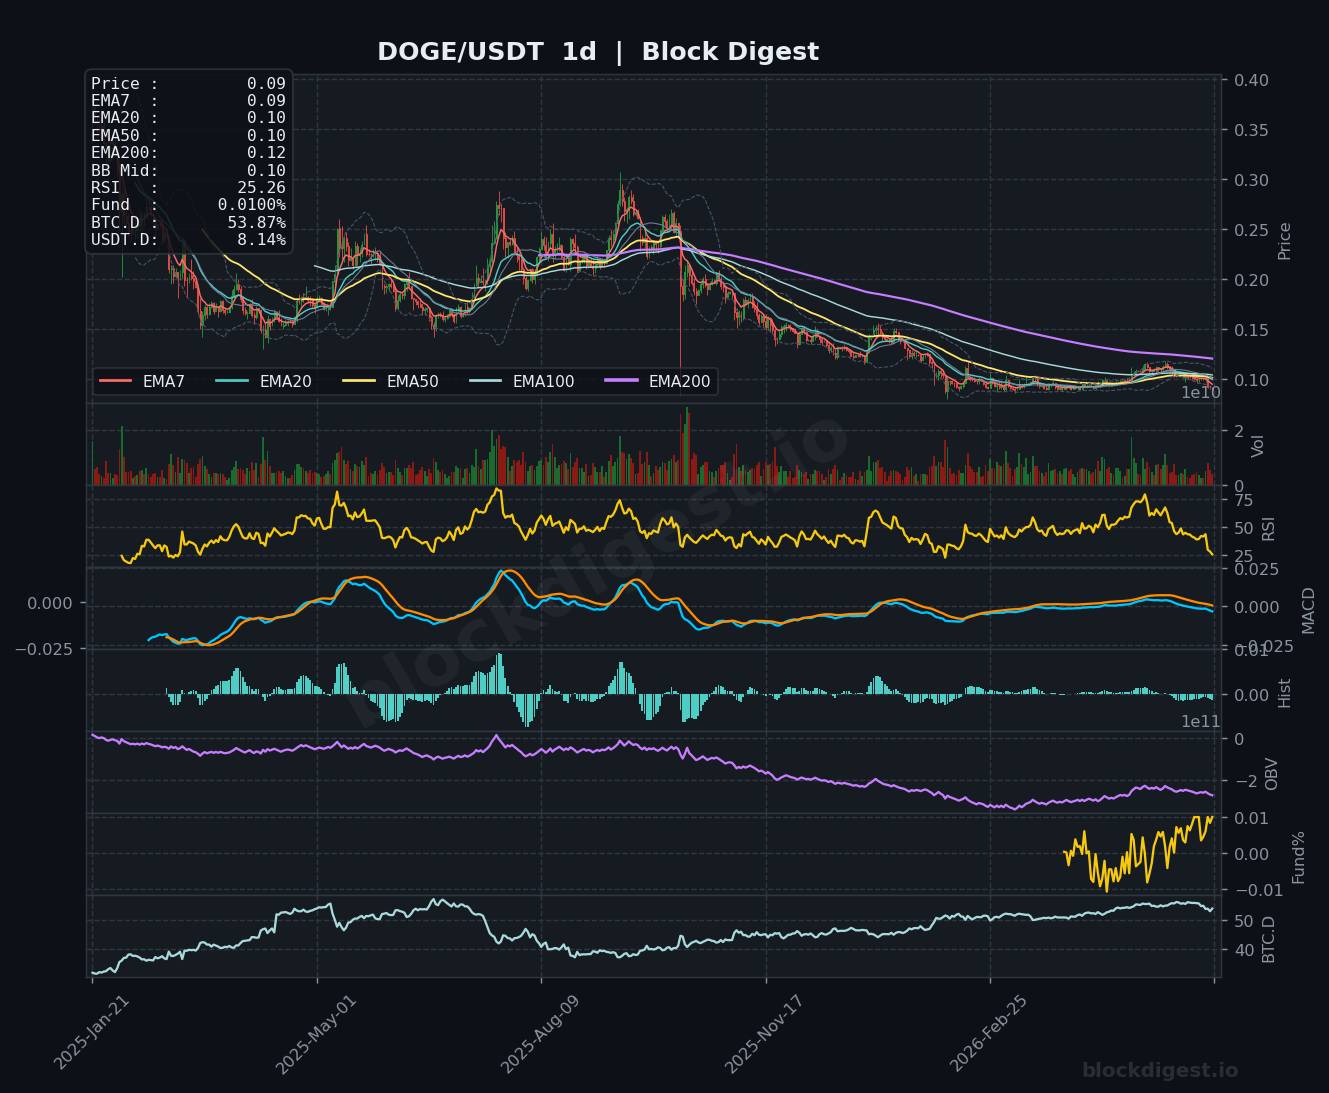
Dogecoin (DOGE)
DOGE is trading at $0.09, firmly trapped in a bearish trend structure with price below all key moving averages across every timeframe — the EMA200 on the daily sits at $0.12, highlighting just how far price has deteriorated from its cycle highs above $0.28. The 4h RSI at 26.07 and the daily RSI at 25.26 both sit in deeply oversold territory, while the 4h MACD remains in a bearish cross with no sign of momentum recovery, and the OBV continues its persistent downward slope reflecting consistent net selling. The 1h chart shows the EMA stack fully compressed and pointing downward, with RSI at 35.75 offering little immediate relief. The $0.08–$0.085 area represents critical psychological and structural support; a failure here could open downside toward multi-month lows, while a reclaim of $0.095–$0.10 is needed to stabilize the near-term outlook.
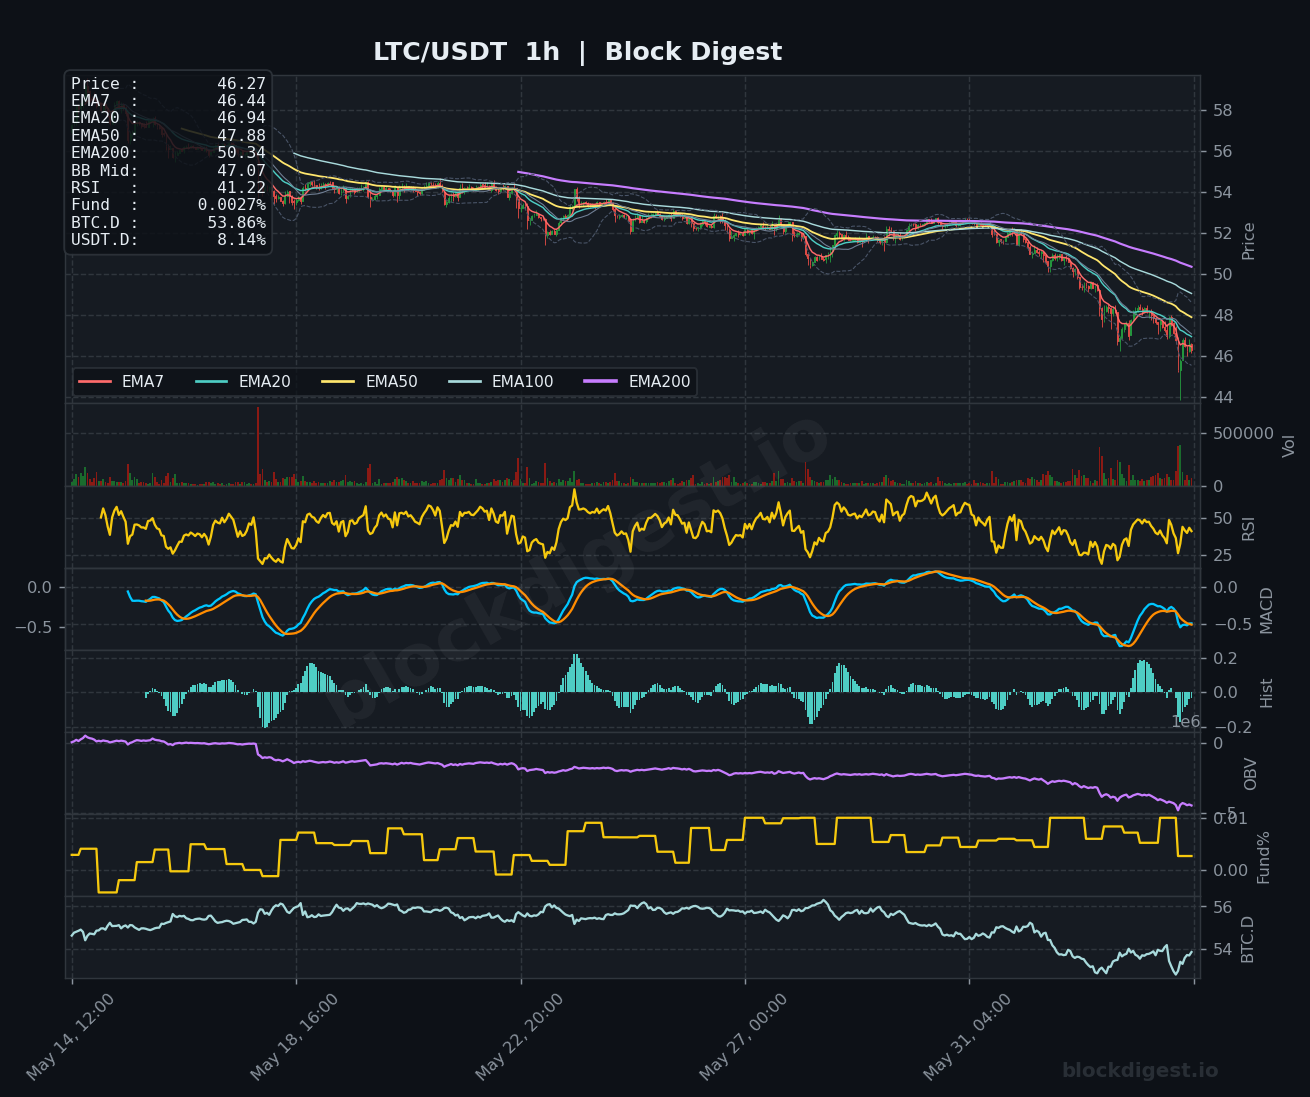
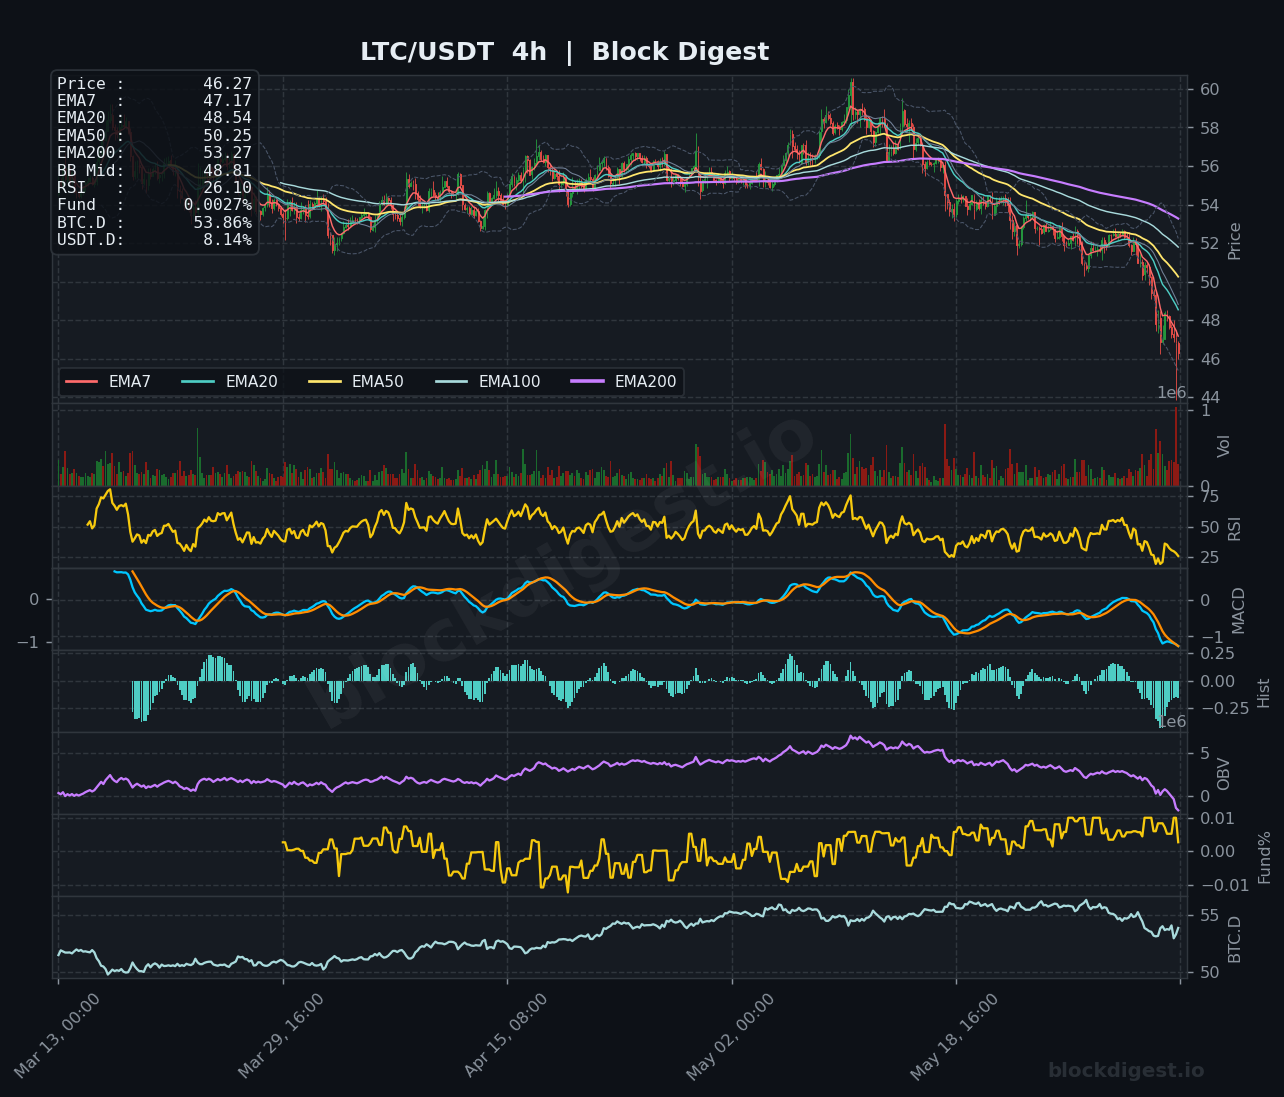
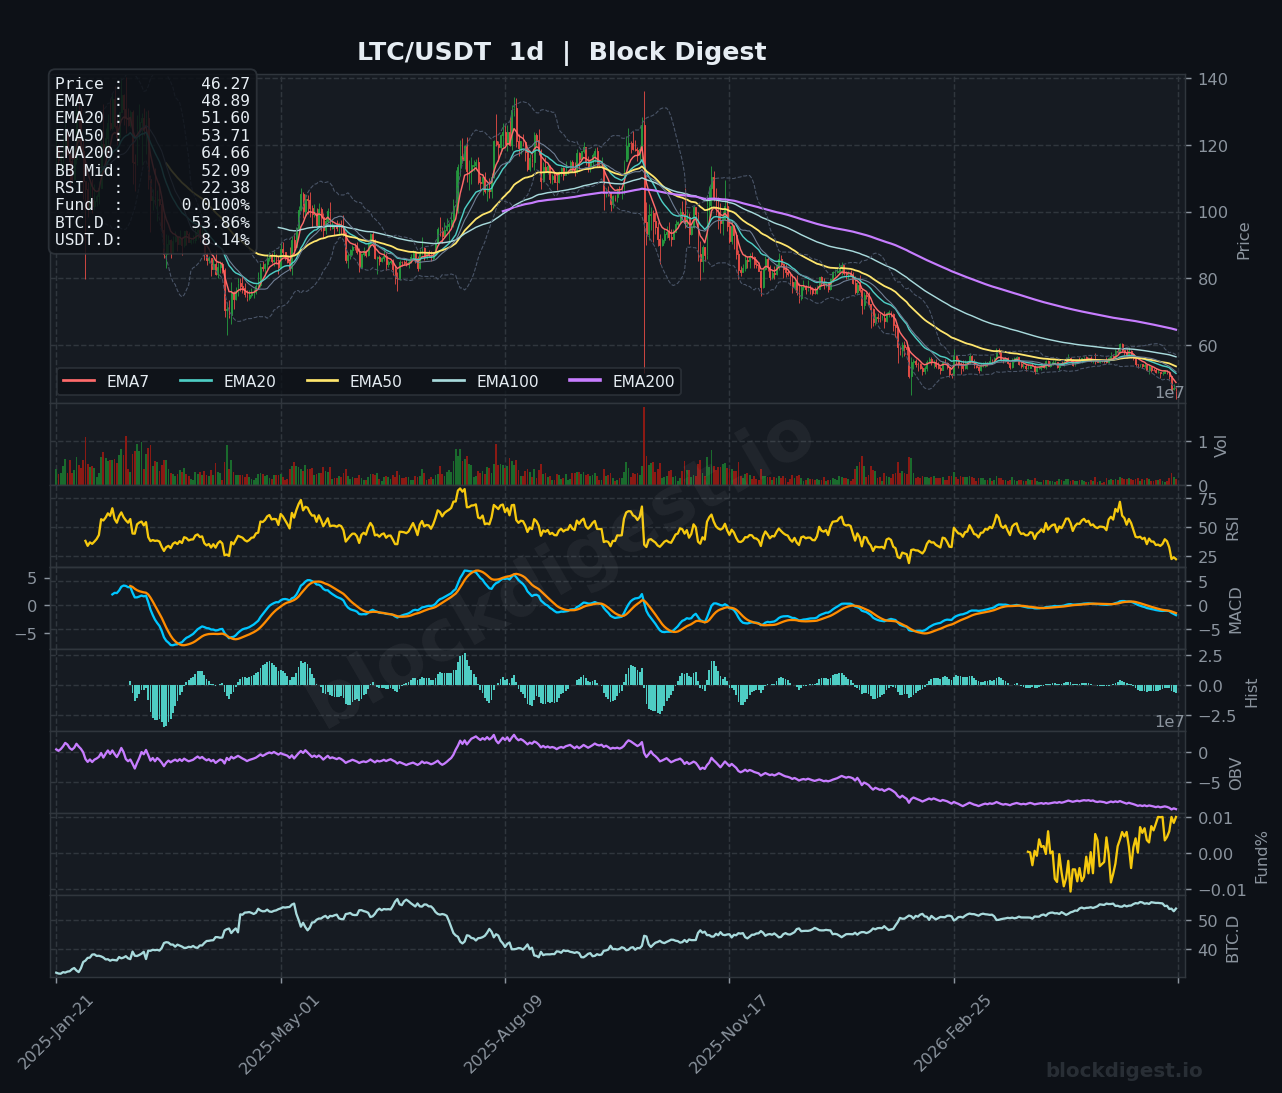
Litecoin (LTC)
LTC is trading at $46.27, one of the weaker performers in today’s review, with price breaking below all EMAs on every timeframe and the daily RSI collapsing to 22.38 — among the most oversold readings in this cohort. The 4h RSI at 26.10 and a deeply negative MACD on the 4h with an expanding bearish histogram reflect accelerating downside momentum, while the OBV across the 1h and 4h charts continues to trend decisively lower, confirming distribution. On the daily chart, the EMA200 at $64.66 sits far above current price, underscoring the severity of the longer-term downtrend that has been in place since the 2025 highs around $130. Near-term support is seen at the $44–$45 zone; any recovery attempt will face stiff resistance from the EMA cluster between $48 and $51.
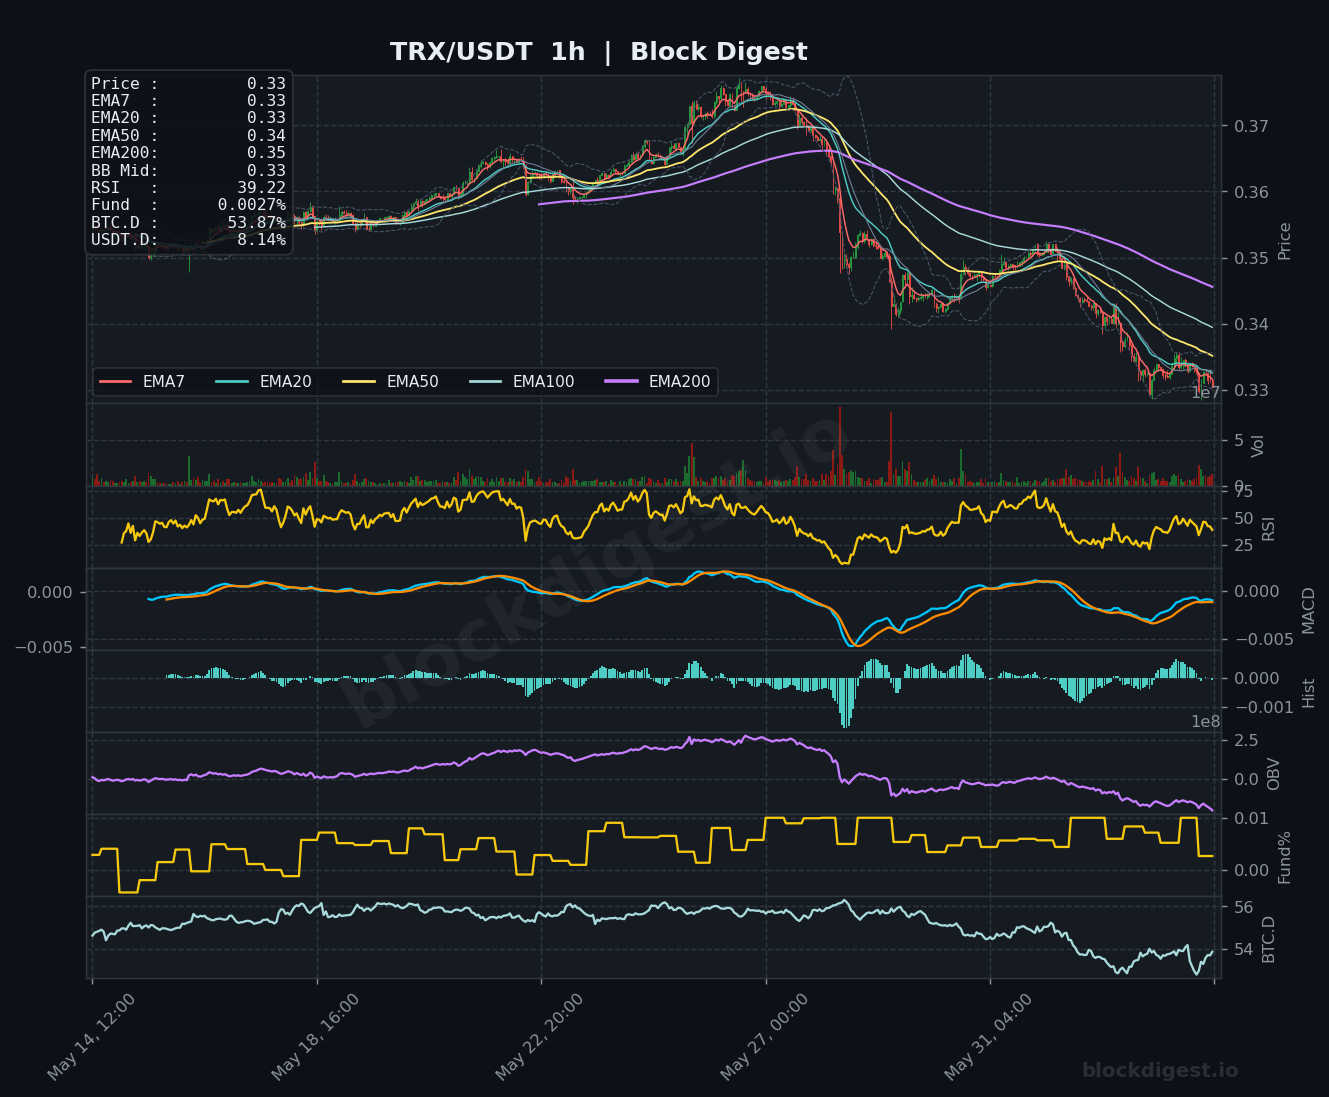
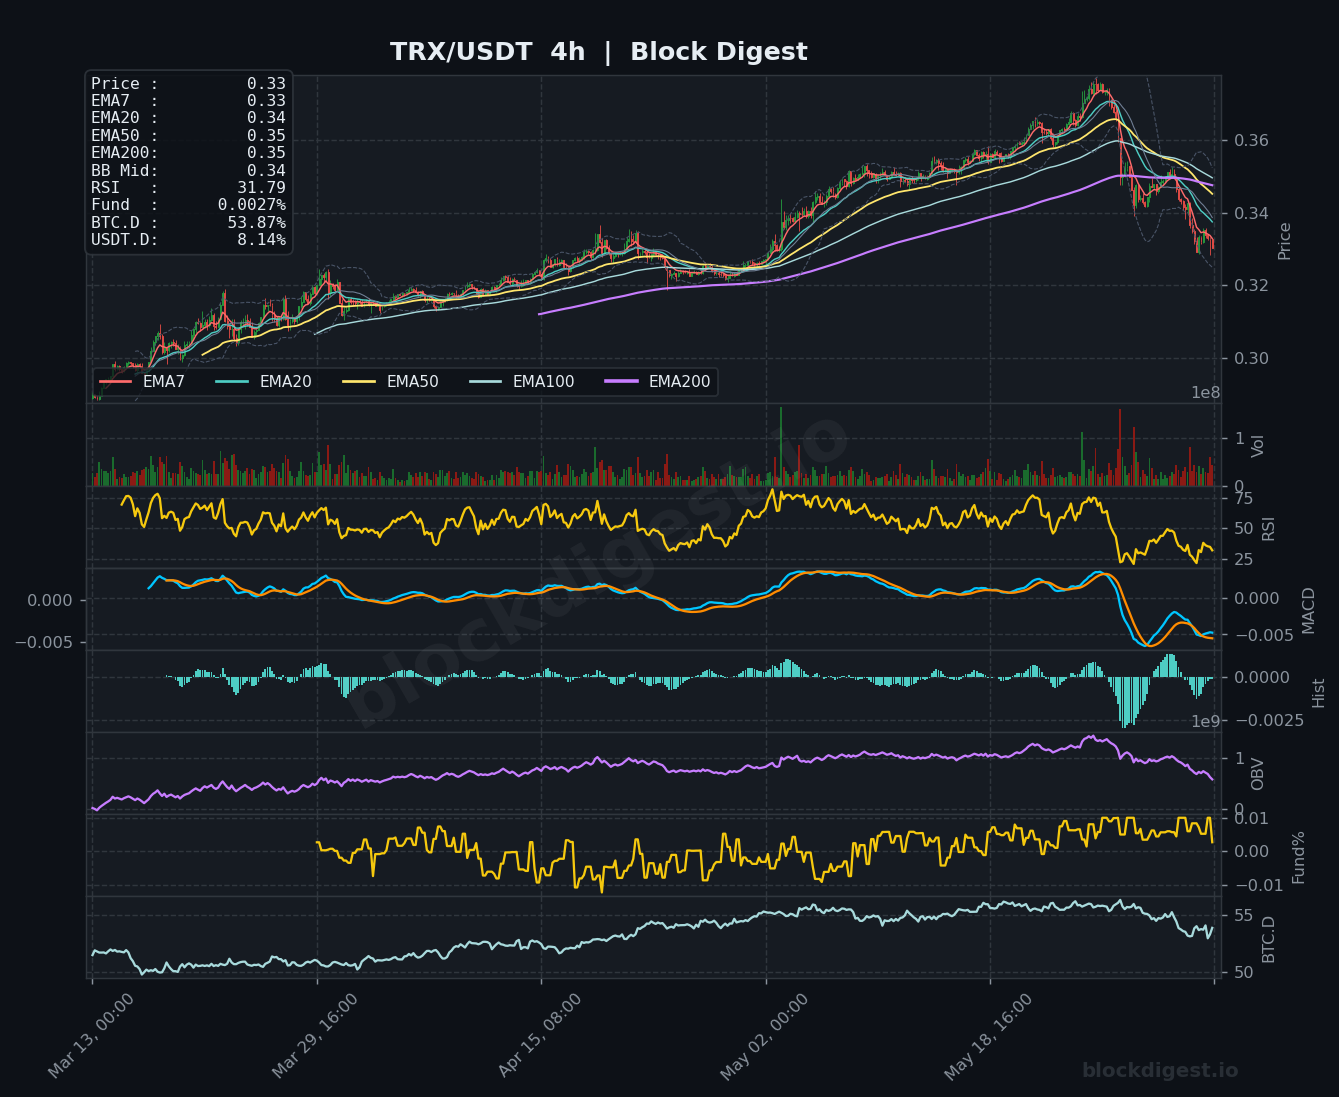
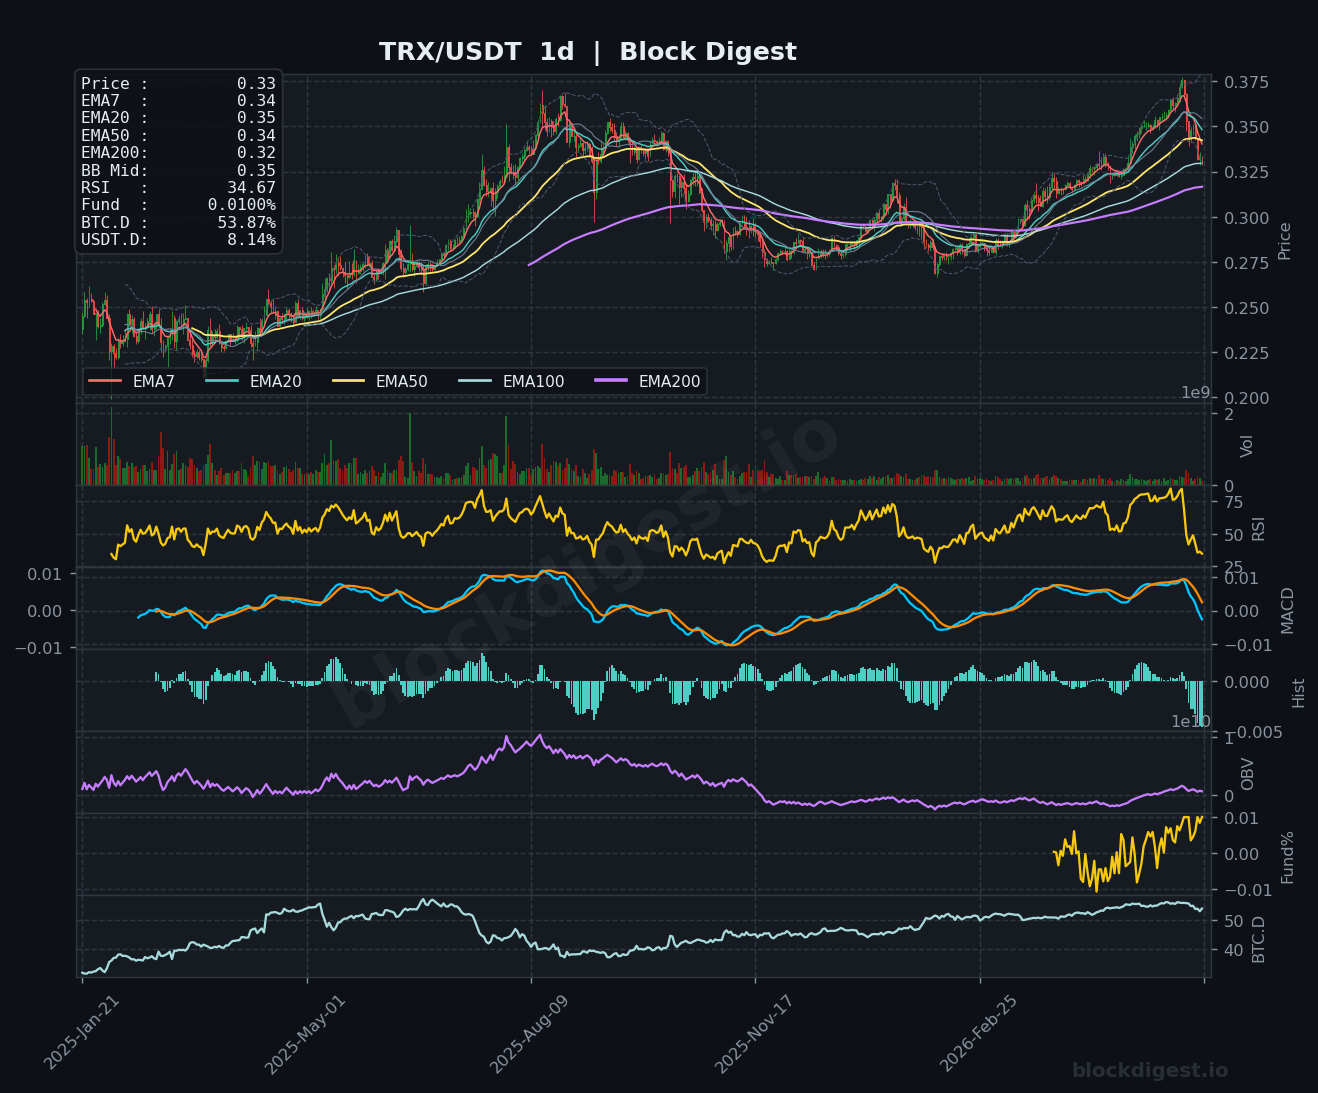
TRON (TRX)
TRX is trading at $0.33, and while it shares the same broad bearish impulse affecting the altcoin market, its structural setup is notably more resilient than peers. The daily chart shows TRX holding above its EMA200 at $0.32 and the daily RSI, though now retreating to 34.67, is not yet in the extreme oversold territory seen in SOL, XRP, or LTC. The 4h RSI at 31.79 and the 4h MACD — while recently making a bearish cross — are coming off a prolonged uptrend that saw TRX grind higher from below $0.30 to near $0.375, suggesting the recent pullback is more of a corrective move within a broader recovery rather than a structural breakdown. Support is well-defined at $0.32–$0.33, and a defense of this zone keeps the intermediate bullish thesis intact; a breakdown below $0.31 would shift the bias decisively bearish.
Altcoin Outlook
The overall altcoin setup as of June 4, 2026, is broadly bearish, with nearly all reviewed assets trading beneath their major moving averages and momentum indicators registering oversold readings that, while extreme, have yet to produce confirmed reversal signals. TRON stands out as the relative outperformer, retaining daily structure above its EMA200 and showing a shallower correction compared to the more severe deterioration in SOL, XRP, LTC, and DOGE. BNB shows a mixed picture — deeply oversold on shorter timeframes but still maintaining a less catastrophic longer-term structure than the hardest-hit names. Key conditions to watch include whether USDT.D begins declining (signaling fresh capital deployment), a potential BTC dominance rollover below 53% that would historically benefit altcoins, and whether the extreme RSI oversold readings across the board eventually produce a reflexive bounce — though until price reclaims meaningful EMA levels, any rallies should be treated as relief bounces rather than trend reversals.
Disclaimer: This analysis is for informational purposes only and does not constitute financial advice. Cryptocurrency markets are highly volatile and unpredictable. All trading decisions should be made based on your own research and risk tolerance. Block Digest is not responsible for any financial losses incurred as a result of acting on this content.