Bitcoin Daily Analysis: Bitcoin Below All EMAs at $72,770
Market Overview
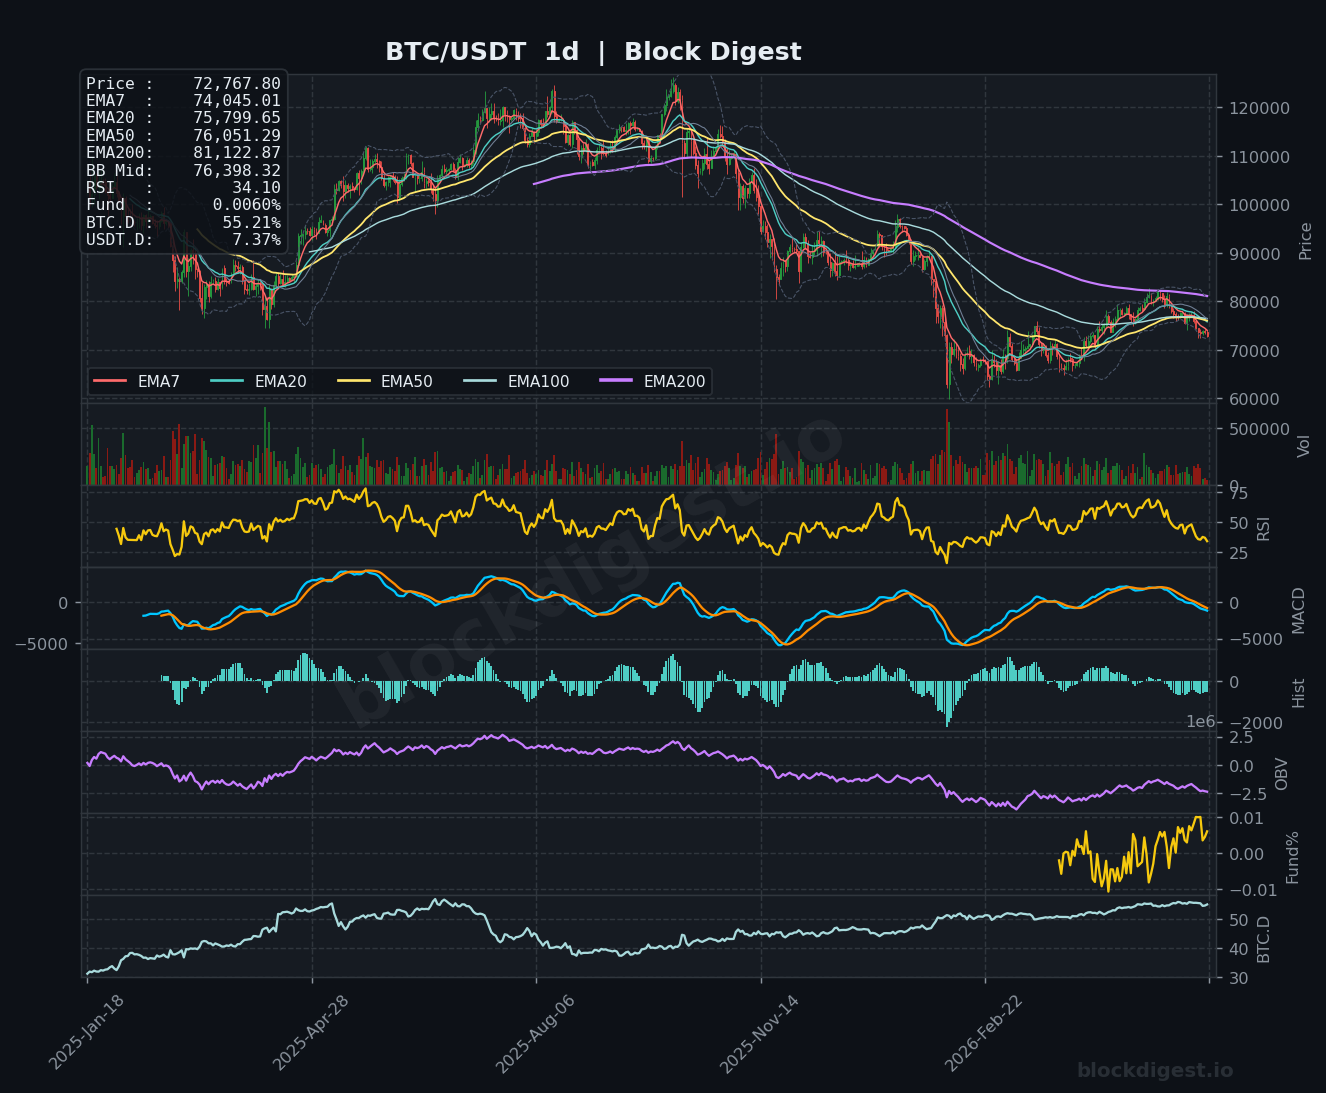
Bitcoin is currently trading at approximately $72,770, sitting beneath every major EMA across all timeframes — a structurally bearish configuration that has persisted for several weeks. On the daily chart, price is printing below the EMA7 ($74,045), EMA20 ($75,800), EMA50 ($76,051), and the EMA200 ($81,123), confirming a well-established downtrend from the October 2025 all-time high of $126,210. The Bollinger Band midline on the daily sits at $76,398, and price continues to hug the lower band, indicating sustained selling pressure without meaningful mean-reversion attempts. Overall market structure on the daily timeframe remains decisively bearish, with each successive rally failing to reclaim prior EMA clusters.
Multi-Timeframe Confluence
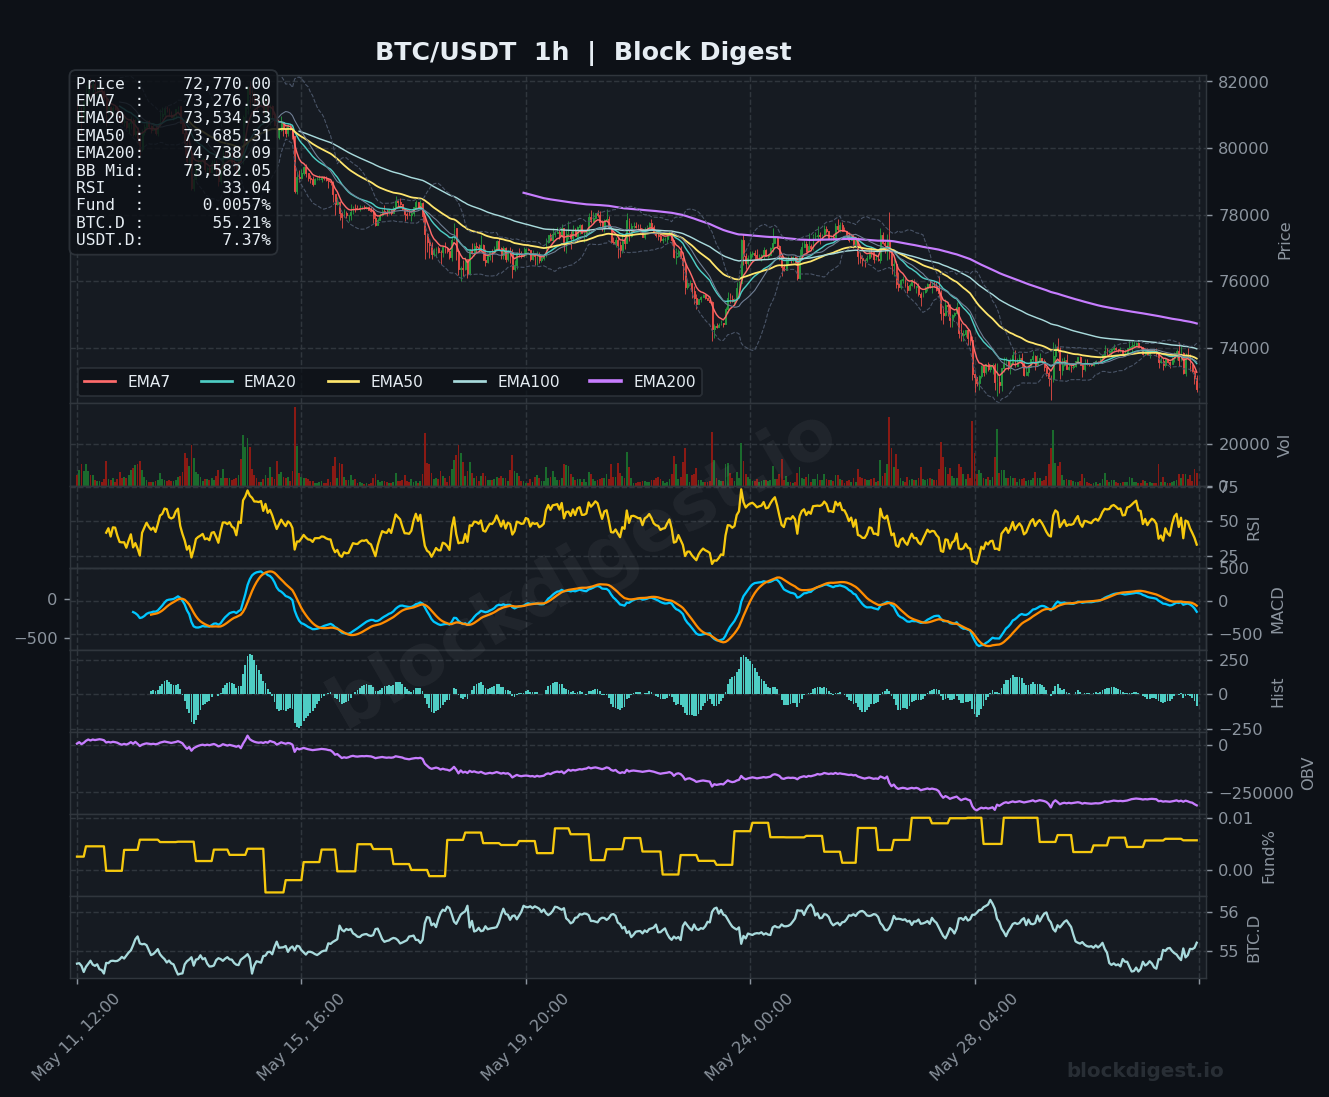
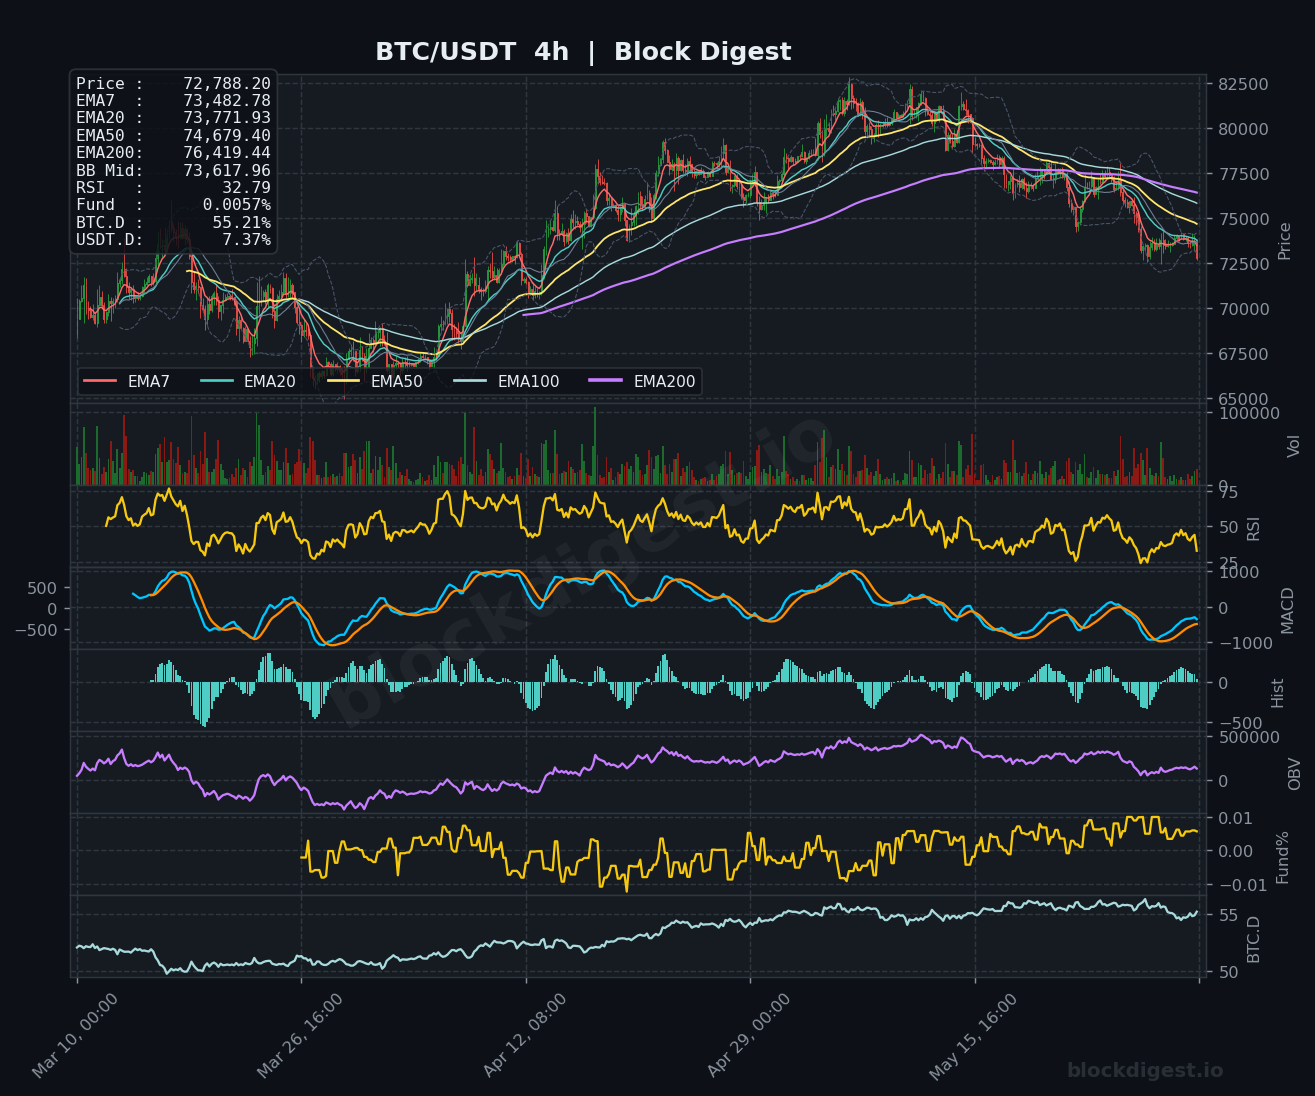
Across all three timeframes, the bearish bias is consistent and reinforcing — there is little divergence to suggest a meaningful trend reversal is imminent. On the 1-hour chart, price ($72,770) trades below the EMA7 ($73,276), EMA20 ($73,534), EMA50 ($73,685), and EMA200 ($74,738), with all short-term EMAs in a bearish descending stack. The 4-hour chart mirrors this structure, with the EMA200 at $76,419 acting as a significant overhead ceiling that has not been challenged recently. The only mild nuance is that the 4-hour RSI has reached a comparable oversold region to prior local bottoms in the recent correction cycle, which could produce a technical bounce — but this would be a counter-trend move within a broader downtrend rather than a structural reversal signal.
Key Levels to Watch
- Resistance: $73,500–$73,685 — Confluent zone where the 1-hour EMA20, EMA50, and 4-hour EMA7 converge; this cluster has been actively suppressing recovery attempts.
- Resistance: $74,679–$75,800 — The 4-hour EMA50 and daily EMA20 align in this range, representing the first meaningful overhead supply zone where sellers are likely to re-engage.
- Resistance: $76,400–$76,419 — The daily Bollinger Band midline ($76,398) and 4-hour EMA200 ($76,419) create a high-conviction resistance ceiling; a reclaim of this zone would be required to shift medium-term bias.
- Support: $72,500–$72,770 — Current price vicinity and recent intraday lows; the immediate line in the sand for short-term bulls.
- Support: $71,000–$71,500 — A psychological and structural level that aligns with prior consolidation visible on the 4-hour chart during the early recovery phase; a breach here would accelerate selling.
- Support: $68,500–$69,000 — Deeper demand zone corresponding to the most recent significant swing low on the 4-hour timeframe; losing this level would signal a more severe trend breakdown.
Momentum & On-Chain Signals
RSI readings are deeply oversold across all three timeframes — the 1-hour RSI sits at 33.04, the 4-hour at 32.79, and the daily at 34.10 — all approaching or within oversold territory, though on the daily timeframe oversold conditions can persist for extended periods during structural downtrends. The 4-hour MACD shows the signal and MACD lines converging near zero from below, with the histogram printing small negative bars, suggesting bearish momentum may be decelerating but has not yet confirmed a bullish crossover. The OBV trend is clearly distributive across both the 1-hour and daily charts — the daily OBV has been declining since the October 2025 peak, confirming that volume is consistently flowing out on down moves. The funding rate remains marginally positive at +0.0057%, indicating the market is not yet in extreme capitulation territory from a derivatives standpoint, which could mean further downside is possible before a sustainable floor forms.
BTC Dominance & Market Sentiment
BTC dominance is currently at 55.21%, a notably elevated reading that reflects a continued flight to relative safety within the crypto ecosystem — altcoins are underperforming even as Bitcoin itself declines. USDT dominance at 7.37% suggests a meaningful portion of capital has rotated into stablecoins, signaling risk-off positioning among market participants. Together, these readings indicate that broader crypto risk appetite remains suppressed, with no clear signs of capital rotating back into risk assets in the near term.
Risk Scenarios
- Bullish case: A decisive hourly close back above $73,685 (EMA50 on the 1-hour) followed by a hold above $74,000 would indicate short-term seller exhaustion, opening a path toward the $75,800–$76,400 resistance cluster. Confirmation from an RSI recovery above 45 on the 4-hour chart and a MACD bullish crossover on that timeframe would strengthen the case for a tactical counter-trend bounce.
- Bearish case: Failure to hold the $72,500 support zone on a closing basis would expose the next significant demand area near $71,000, and a break below that level on elevated volume could accelerate a move toward the $68,500–$69,000 structural support zone. This scenario would be further validated by the 1-hour OBV continuing its downward trajectory alongside renewed negative MACD histogram expansion.
Outlook
As of June 1, 2026, Bitcoin’s technical setup remains firmly bearish across all three timeframes, with price trading below every major EMA, OBV in distribution, and RSI in oversold territory without yet showing a credible reversal signal. The most critical level to monitor over the next 24–48 hours is the $72,500 support floor — holding this level is the minimum prerequisite for any stabilization narrative, while the $73,000 level cited in recent market commentary as a “bull case close” aligns closely with the 1-hour EMA cluster. The $1.3 billion IBIT dark-pool dump and five consecutive weeks of ETF outflows add a meaningful institutional distribution overhang that complicates any near-term recovery thesis. Until price can reclaim the $74,679–$76,400 range and EMAs begin to flatten or curl upward on the 4-hour chart, the path of least resistance remains to the downside, and any bounces should be treated as potential re-entry opportunities for bears rather than confirmed reversals.
Disclaimer: This analysis is for informational purposes only and does not constitute financial advice. Cryptocurrency markets are highly volatile and unpredictable. All trading decisions should be made based on your own research and risk tolerance. Block Digest is not responsible for any financial losses incurred as a result of acting on this content.