BTC Weekly Analysis – Week of May 18, 2026
Weekly Market Overview
Bitcoin closed this week at $76,991, marking a continuation of the corrective phase that has dominated market structure since the all-time high rejection above $123,000 earlier this year. The current weekly candle formation shows consolidation around the $77,000 level, with price action compressed between the weekly EMA7 ($76,631) and EMA20 ($78,144), indicating indecision at a critical structural juncture. This week’s price action represents a test of key intermediate support after the sharp decline from the $126,000 peak, with the market now attempting to establish a base above the psychological $75,000 level while facing headwinds from macroeconomic concerns including rate hike fears and sticky inflation data.
Higher Timeframe Structure
On the weekly timeframe, Bitcoin’s EMA structure reveals a bearish configuration with price trading below the EMA20, EMA50 ($85,147), and significantly below the EMA100 ($69,130), though notably above the rising EMA200 ($69,130). The Bollinger Band midpoint sits at $75,015, with current price action hovering just above this critical dynamic support level, suggesting the market is testing the lower boundary of its recent trading range. The weekly chart context shows Bitcoin has retraced approximately 38% from its all-time high, with the current structure forming a potential higher low above the late 2024 lows around $50,000-$55,000, though the failure to reclaim the $80,000-$85,000 zone has kept the intermediate-term trend under pressure.
Multi-Timeframe Confluence
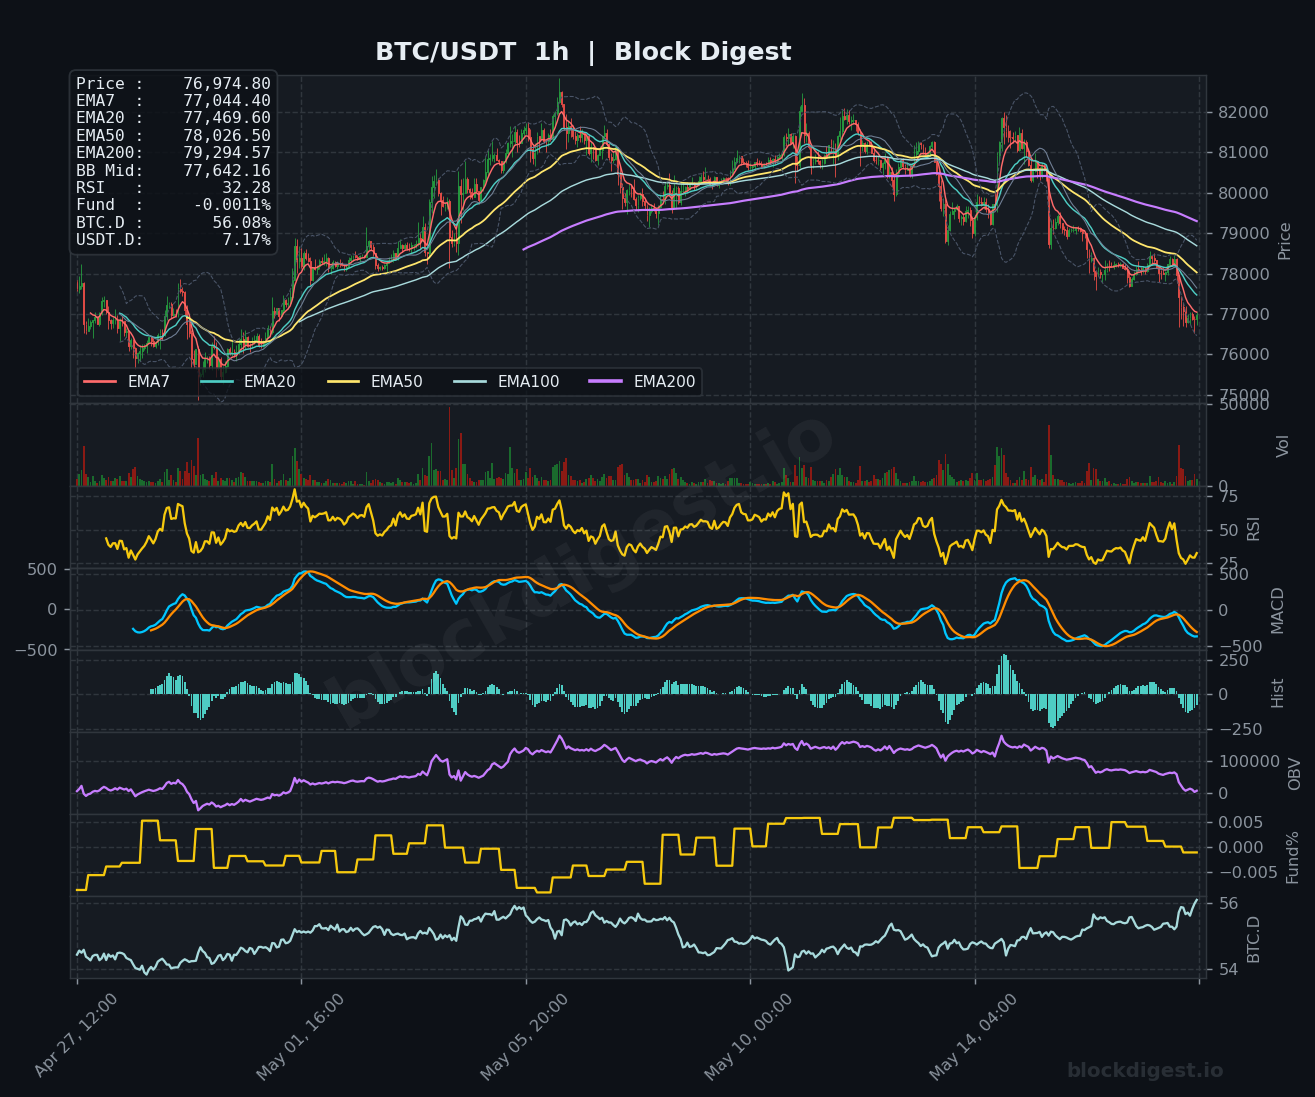
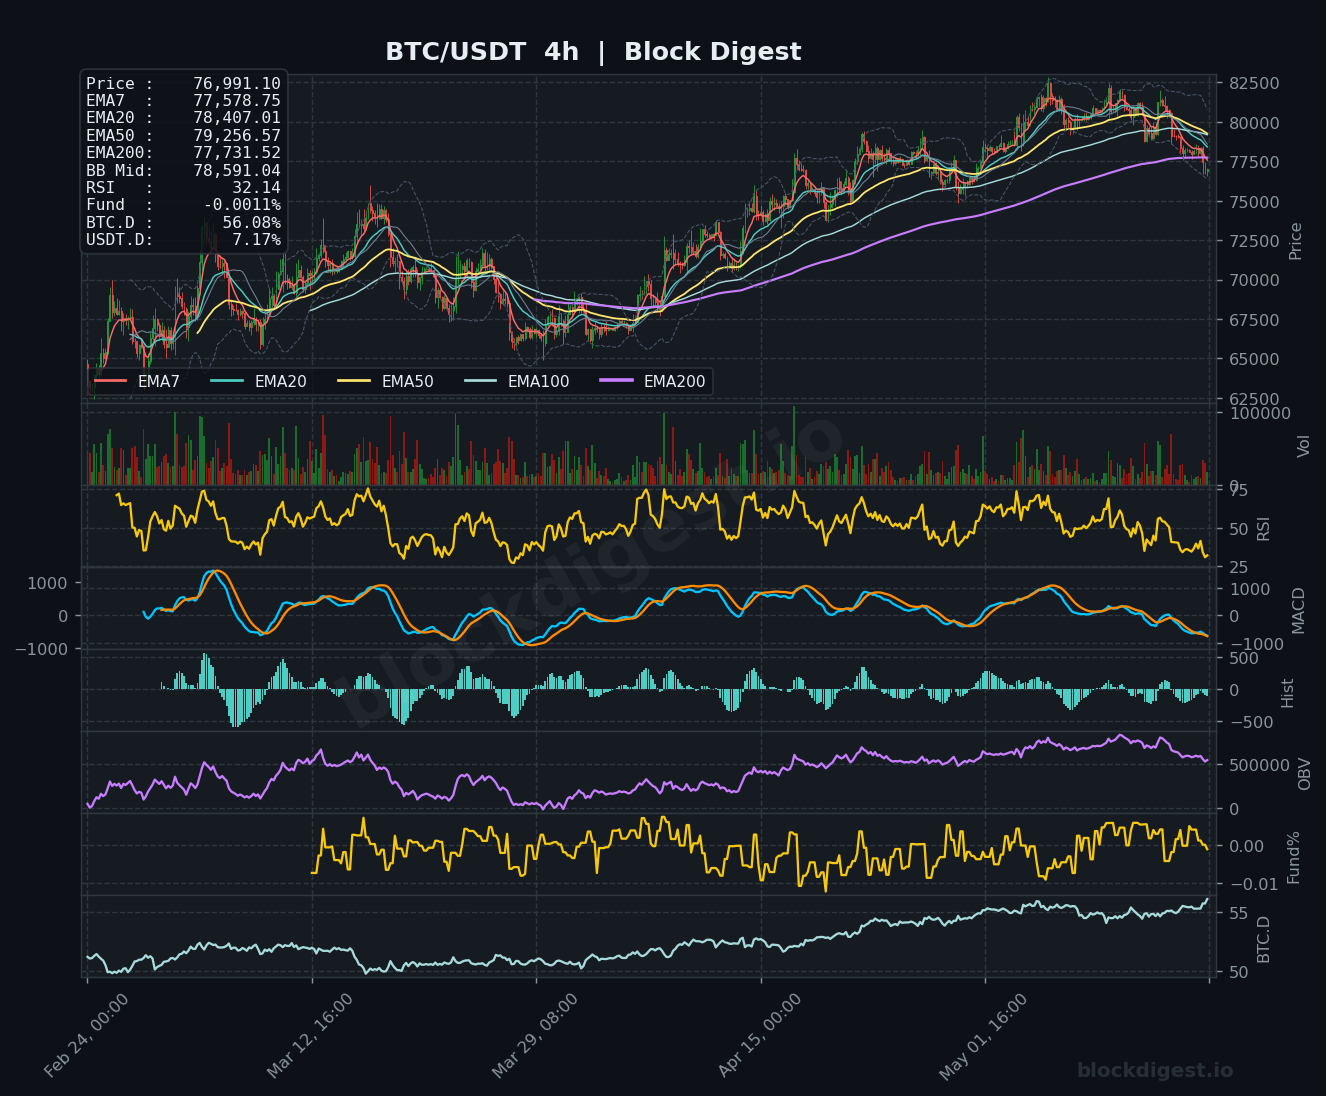
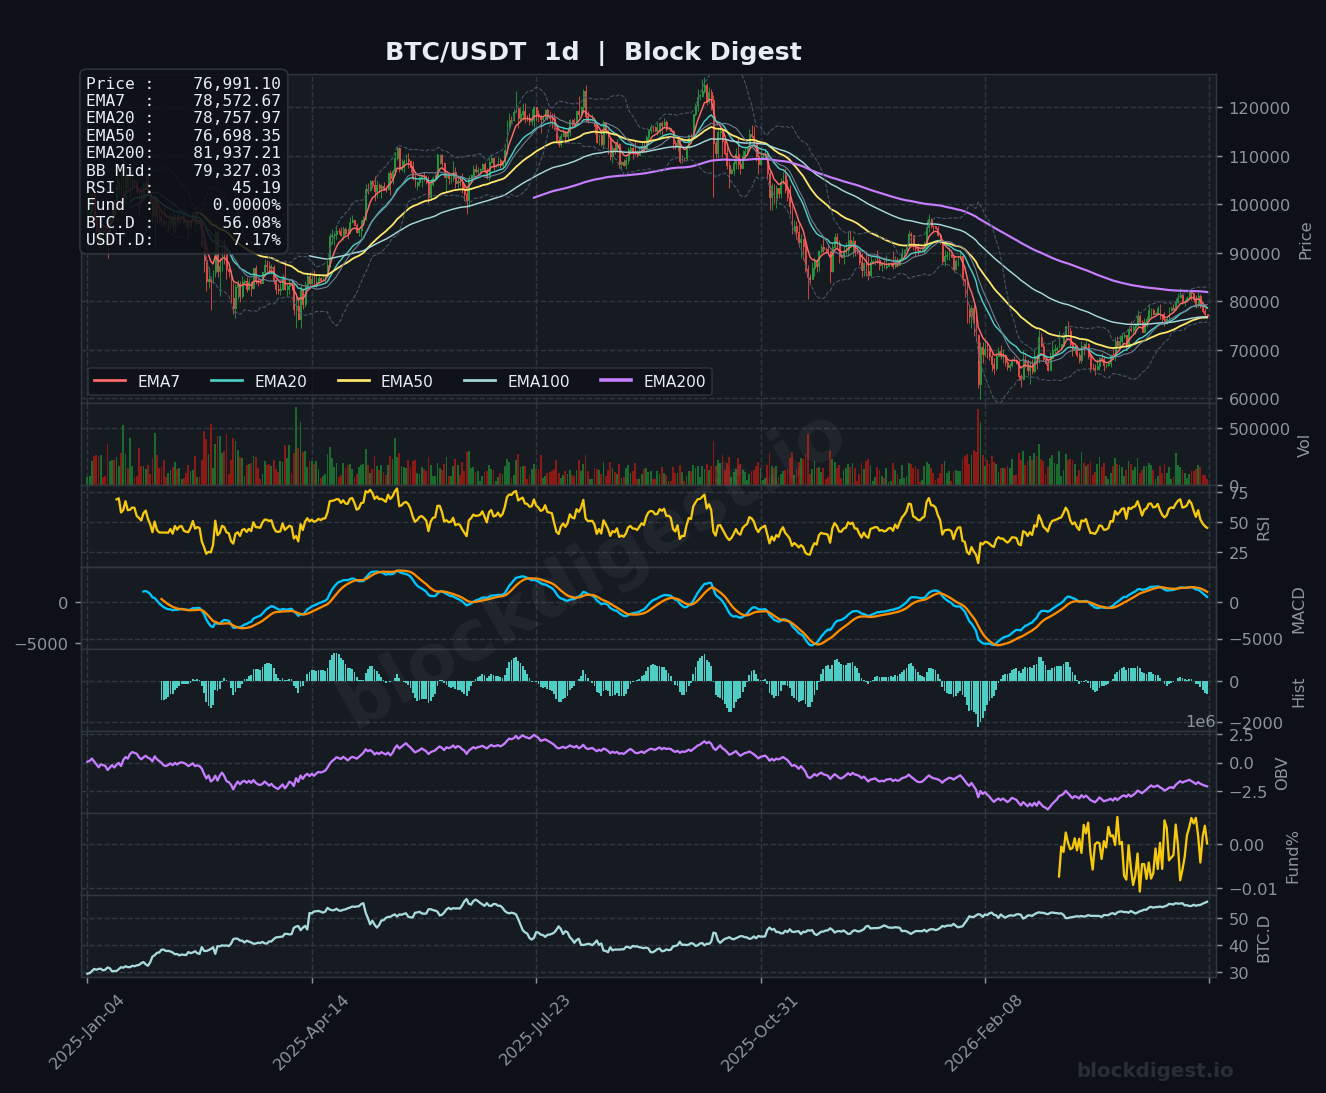
The multi-timeframe analysis reveals significant bearish alignment across daily and 4-hour charts, with all shorter-term exponential moving averages (EMA7 through EMA50) trading below the weekly EMA50 at $85,147, confirming sustained downward momentum. The daily timeframe shows price struggling below its EMA200 ($81,937), while the 4-hour chart displays a similar bearish EMA stack with price at $76,991 below all major moving averages except the EMA200 ($77,731). Critical confluence emerges around the $77,500-$78,500 zone where the 4-hour EMA200, daily EMA20 ($78,757), and weekly EMA20 ($78,144) converge, creating a significant resistance cluster that has capped intraweek recovery attempts. The alignment of declining momentum across all timeframes suggests sellers remain in control of the near-term structure.
Key Weekly Levels
Weekly Resistance:
- $78,500-$79,300: Weekly EMA20/Daily EMA200 confluence zone – reclaiming this cluster would signal the first meaningful shift in momentum and could trigger short covering
- $82,000-$82,500: Weekly EMA50/previous higher low from April – breaking above here would invalidate the bearish weekly structure and open the door to $85,000+
- $85,000-$86,000: Key psychological resistance and the 50-week EMA, representing the gateway to trend reversal; failure to reclaim this level keeps Bitcoin in corrective mode
Weekly Support:
- $75,000-$76,000: Bollinger Band midpoint and current consolidation floor – loss of this level would likely accelerate selling toward the next major support zone
- $72,000-$73,000: Previous consolidation area from March and April, representing the last defense before a deeper correction
- $68,000-$69,500: Weekly EMA100/200 confluence zone and critical macro support – a breakdown below this range would signal a potential return to bear market structure
Momentum & Volume Analysis
The weekly RSI at 45.84 indicates neutral-to-bearish momentum, sitting well below the 50 midpoint but not yet approaching oversold conditions, suggesting additional downside potential before a meaningful reversal catalyst emerges. The MACD remains in bearish territory with negative histogram values deepening on the weekly timeframe, while both daily and 4-hour MACD indicators show persistent bearish crossovers and declining momentum. On-Balance Volume (OBV) has declined significantly from its peak, confirming distribution and suggesting that recent price weakness is accompanied by genuine selling pressure rather than merely low-volume drift. The Funding Rate hovering near neutral (0.0000% on daily, -0.00011% on 4-hour) indicates balanced positioning in perpetual futures markets, with neither aggressive long nor short leverage buildup—this neutral funding environment suggests the market is waiting for a catalyst rather than positioned for an imminent volatility event.
BTC Dominance & Altcoin Implications
Bitcoin dominance currently stands at 56.08%, reflecting a sustained uptrend that has characterized the entire 2025-2026 cycle and indicating continued capital rotation toward BTC as a relative safe haven within the crypto ecosystem. USDT dominance at 7.17% remains elevated compared to historical bull market lows, suggesting persistent risk-off sentiment and caution among crypto participants. The combination of rising BTC dominance alongside Bitcoin’s own price weakness creates a challenging environment for altcoins, which have underperformed significantly during this corrective phase. Should Bitcoin establish a decisive bottom and reverse higher, the elevated dominance suggests BTC will likely lead any recovery initially before capital eventually rotates back into higher-beta altcoin positions in a later stage of recovery.
Risk Scenarios
Bull case: If Bitcoin can reclaim and hold above the $78,500 resistance cluster (weekly EMA20/daily EMA200 confluence) with supporting volume expansion, it would trigger the first bullish structural shift since the April highs and likely catalyze short covering that could drive price toward $82,000-$85,000. A decisive break above $85,000 with momentum confirmation would invalidate the corrective structure and open pathways toward $90,000 and potentially a retest of the $100,000 psychological level within the next 6-8 weeks. This scenario gains probability if macroeconomic conditions improve or if institutional buying resurfaces, particularly if RSI can push back above 50 and MACD generates a bullish crossover on the daily timeframe.
Bear case: Failure to defend the $75,000-$76,000 support zone, particularly the Bollinger Band midpoint at $75,015, would likely trigger accelerated selling toward the $72,000-$73,000 region and potentially the critical $68,000-$69,500 weekly EMA100/200 support cluster. A breakdown below $68,000 would represent a major structural failure and could catalyze a deeper correction toward the $60,000-$62,000 range, especially if accompanied by deteriorating macro conditions or sustained negative funding rates. This scenario is supported by the current bearish EMA alignment, negative MACD trajectory, and declining OBV, with risk amplified by the fact that RSI has significant room to fall before reaching oversold extremes.
Weekly Outlook
Bitcoin enters the week ahead in a critical decision zone, consolidating just above the weekly Bollinger Band midpoint with momentum indicators pointing to continued weakness but no capitulation signals yet present. The $75,000-$76,000 zone represents the line in the sand for the week, with defense of this level essential to prevent a cascade toward deeper support structures. Key catalysts to monitor include any macro economic data releases related to inflation and interest rate policy, as the current correlation with traditional risk assets remains elevated and Bitcoin’s price action continues to respond to broader financial market sentiment. The critical level to watch for any bullish reversal is the $78,500 resistance cluster—a reclaim here would shift the near-term bias neutral-to-bullish, while failure to defend $75,000 would confirm continuation of the corrective trend. The overall weekly setup presents an asymmetric risk/reward profile with near-term downside risk toward $72,000 balanced against potential for a sharp reversal rally if buyers emerge to defend current support, though the path of least resistance appears to favor range-bound consolidation between $73,000-$80,000 until a clearer macro catalyst emerges.
Disclaimer: This analysis is for informational purposes only and does not constitute financial advice. Cryptocurrency markets are highly volatile and unpredictable. All trading decisions should be made based on your own research and risk tolerance. Block Digest is not responsible for any financial losses incurred as a result of acting on this content.
Stay Ahead of the Market
Follow BlockDigest for crypto market intelligence, research and real-time updates.